 Synthyra
Research
9 min read
Synteract-4: Interaction Prediction as Retrieval
Synteract-4 scores protein interactions from sequence alone, processing each protein once instead of once per pair, which turns a proteome-scale screen from a queue of predictions into a search.
Logan Hallee
September 18, 2025
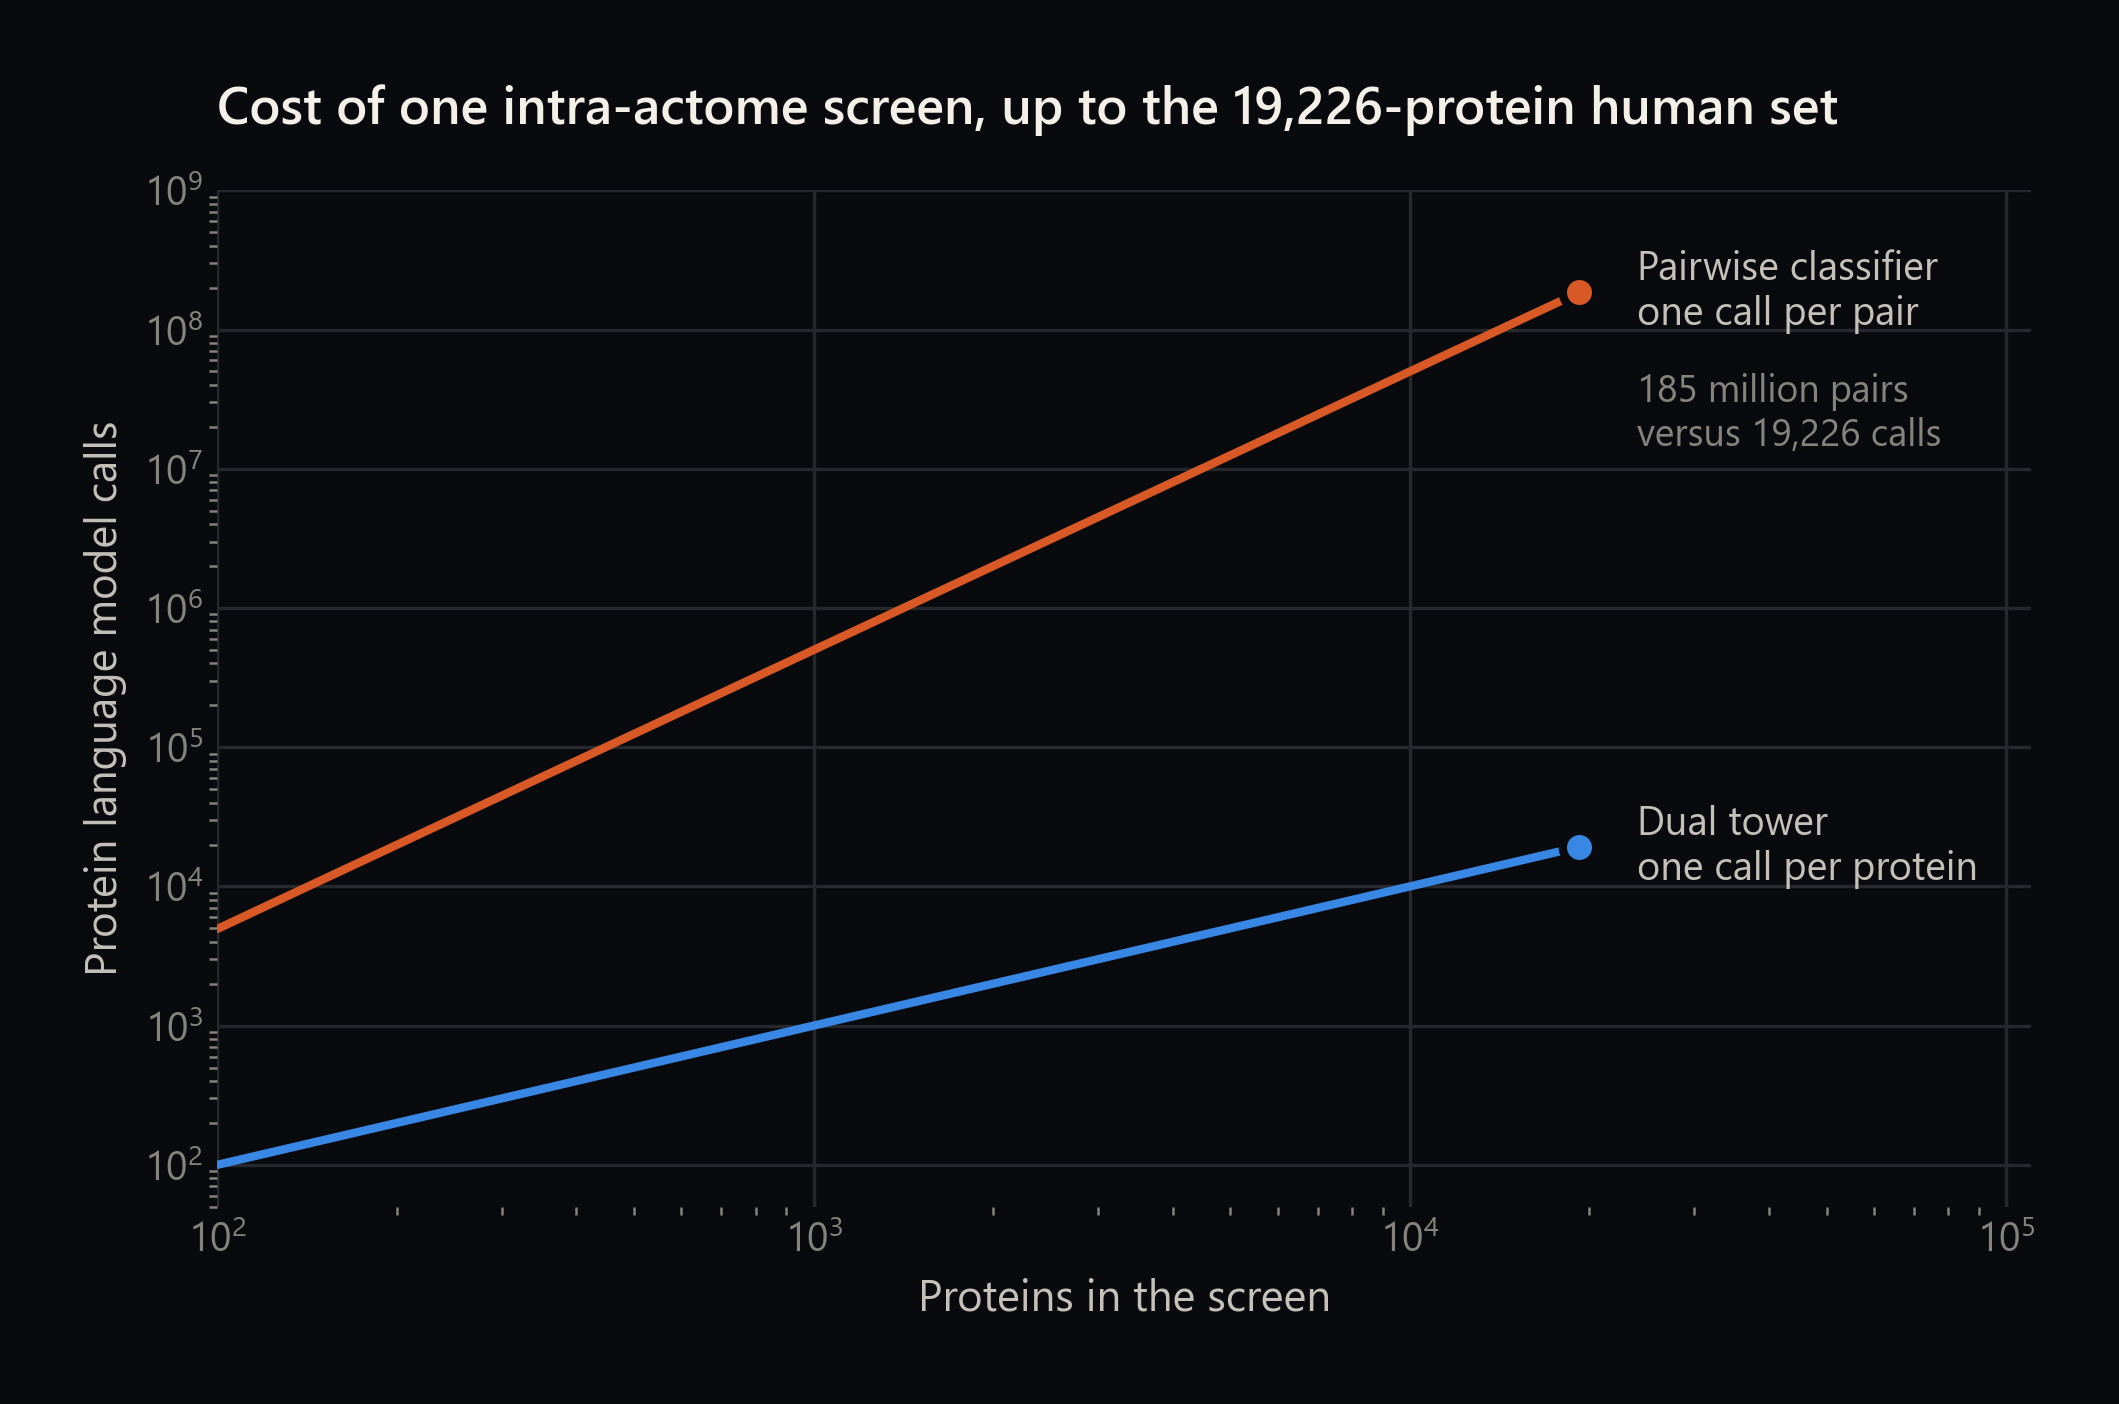
A protein interaction predictor is usually built as a classifier over pairs. You hand it protein A and protein B together, it computes over both at once, and it returns a probability. That design is a natural fit for a benchmark, where the test set is a list of pairs someone already wrote down.
It is an awkward fit for the question biologists actually ask, which is rarely about one pair. It is closer to "what does this protein touch?" or "where does this pathogen plug into its host?" Those questions range over the whole proteome, and a proteome is a quadratic object. Twenty thousand proteins make roughly two hundred million pairs.
Synteract-4 changes what the model is asked to produce. Instead of a verdict about a pair, it produces one vector per protein, and the interaction score is a comparison of two such vectors. Each protein is processed once, whether it appears in one candidate pair or twenty thousand. A full interactome screen stops being a queue of model calls and becomes a lookup.
In plain terms
Think of it like a library. The pairwise approach walks to the shelf, pulls two books, and reads both cover to cover to decide whether they belong together. The retrieval approach reads every book once, writes a summary card for each, and then answers the same question by comparing cards. The reading happens once. The comparing is nearly free.
Why the cost structure is the point
The gap in Figure 1 is not an efficiency footnote. It decides which experiments are thinkable. A method that needs one expensive forward pass per pair can be run on a curated shortlist and not much else. A method that needs one pass per protein can be run on every pair in a proteome, and then again on a second proteome, and then across the two.
That is the workflow Atlas is built around: a query neighborhood, an intra-actome map for one organism, a host-pathogen inter-actome screen. None of those are single predictions. All of them are searches.
Two things follow from that shape, and both are properties a user can check rather than design choices to take on faith. Sequence is the only input: no structures, no genomic context, no per-species tuning at evaluation time. And the whole thing trains and runs on a single GPU, which is why a proteome-scale screen is something you schedule rather than something you apply for.
Four evaluation surfaces, not one
Interaction prediction has a long history of benchmarks that reward the wrong thing, which is a subject we have written about at length. So the evaluation runs across four surfaces that fail in different ways.
Pairwise, on a leakage-controlled split
The Bernett gold-standard benchmark partitions proteins so that no sequence above 40 percent identity crosses between train, validation, and test. It is deliberately unforgiving; most published methods do not clear 0.7 ROC AUC on it.
Bernett gold-standard test set
0.34
MCC
Highest reported on this split; next best published is 0.30
0.73
ROC AUC
Most prior methods sit below 0.70
0.67
F1
Threshold chosen on the validation split
An MCC of 0.34 is the best number anyone has reported on this split, and it is still a long way from solved. At useful recall the model misses many real interactions and calls many false ones. This benchmark remains hard, and the leaderboard position matters mainly as a sanity check that the retrieval framing has not quietly given something up.
Proteome-wide, against a per-species supervised baseline
The second surface is a full intra-actome screen for human and nineteen bacterial pathogens, compared against ProteomeLM, which trains a logistic-regression head on each evaluation proteome and uses orthology information Synteract-4 never sees.
| Panel | Synteract-4 | ProteomeLM | Note |
|---|---|---|---|
| H. sapiens, full evaluation | 0.968 | 0.830 | STRING combined score at or above 990 |
| H. sapiens, strict zero-shot subset | 0.953 | not reported | 43.5 of 184.8 million pairs, both proteins outside every training cluster |
| 19 bacterial pathogens, mean | 0.897 | 0.898 | Leads on 10 of 19 species |
The zero-shot row is the one that matters. Roughly half the human proteins fall inside some training cluster, so the headline 0.968 is not a clean generalization number. Restricting to pairs where both proteins sit outside every training cluster costs only 0.015, which suggests the model is not simply recognizing sequences it has seen.
Where it loses, it loses consistently: L. pneumophila, H. pylori, and M. tuberculosis each trail by 0.03 to 0.05. A likely explanation is bacterial co-evolution signal that a per-species head can exploit and a model trained on a human-heavy mix cannot see.
Precision where it counts
Averaged ROC AUC over hundreds of millions of pairs is a forgiving statistic. The screen that a researcher actually reads is the top of the ranked list.
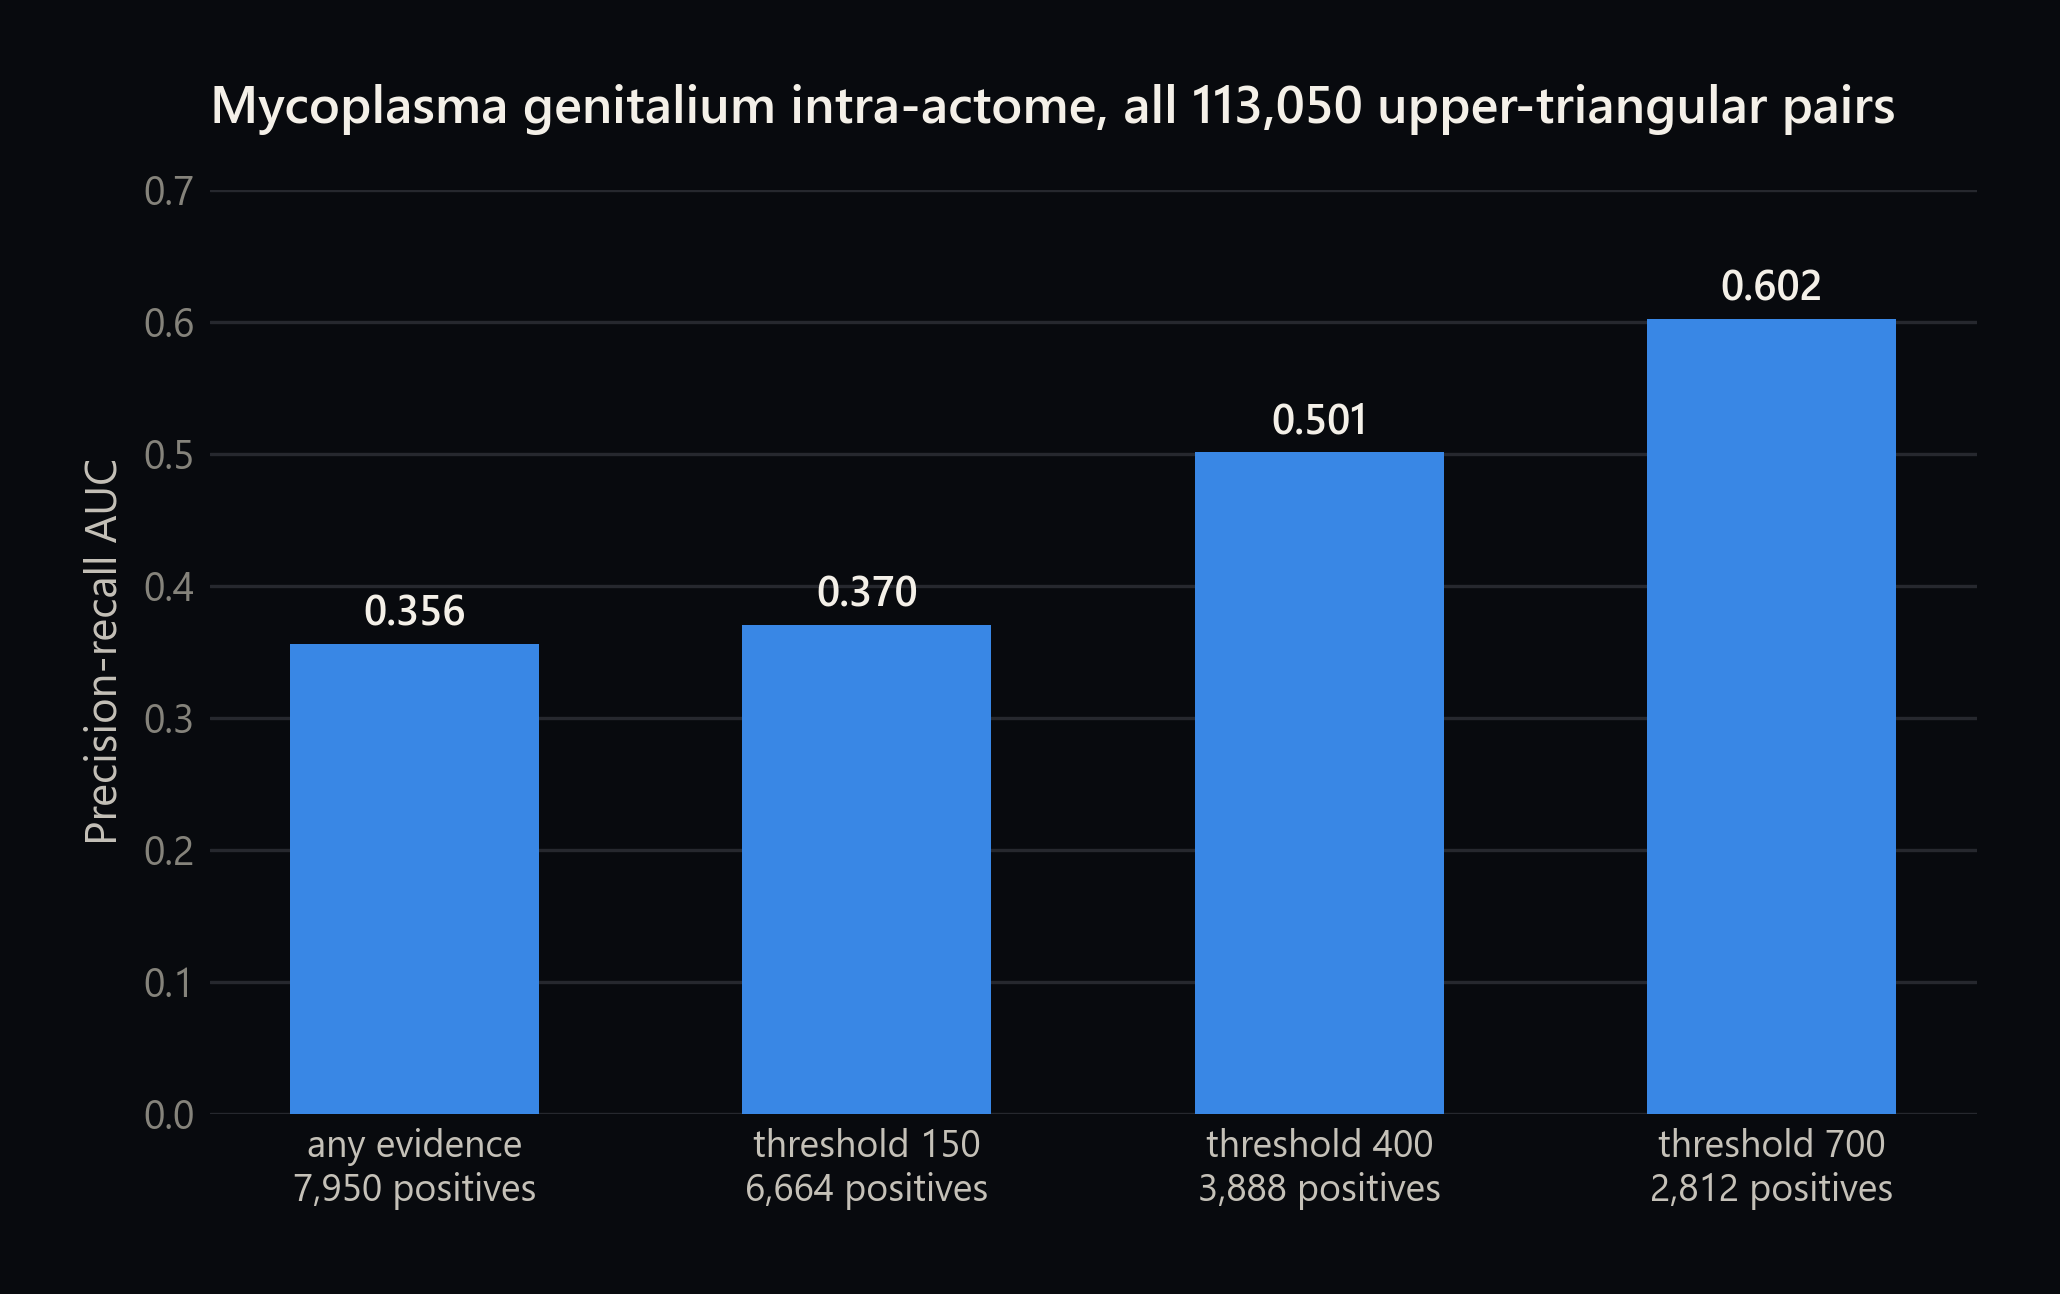
(a) Precision climbs as the positive set is restricted to better-evidenced interactions, a 1.6-fold lift from the weak-evidence shelf to the high-confidence shelf.
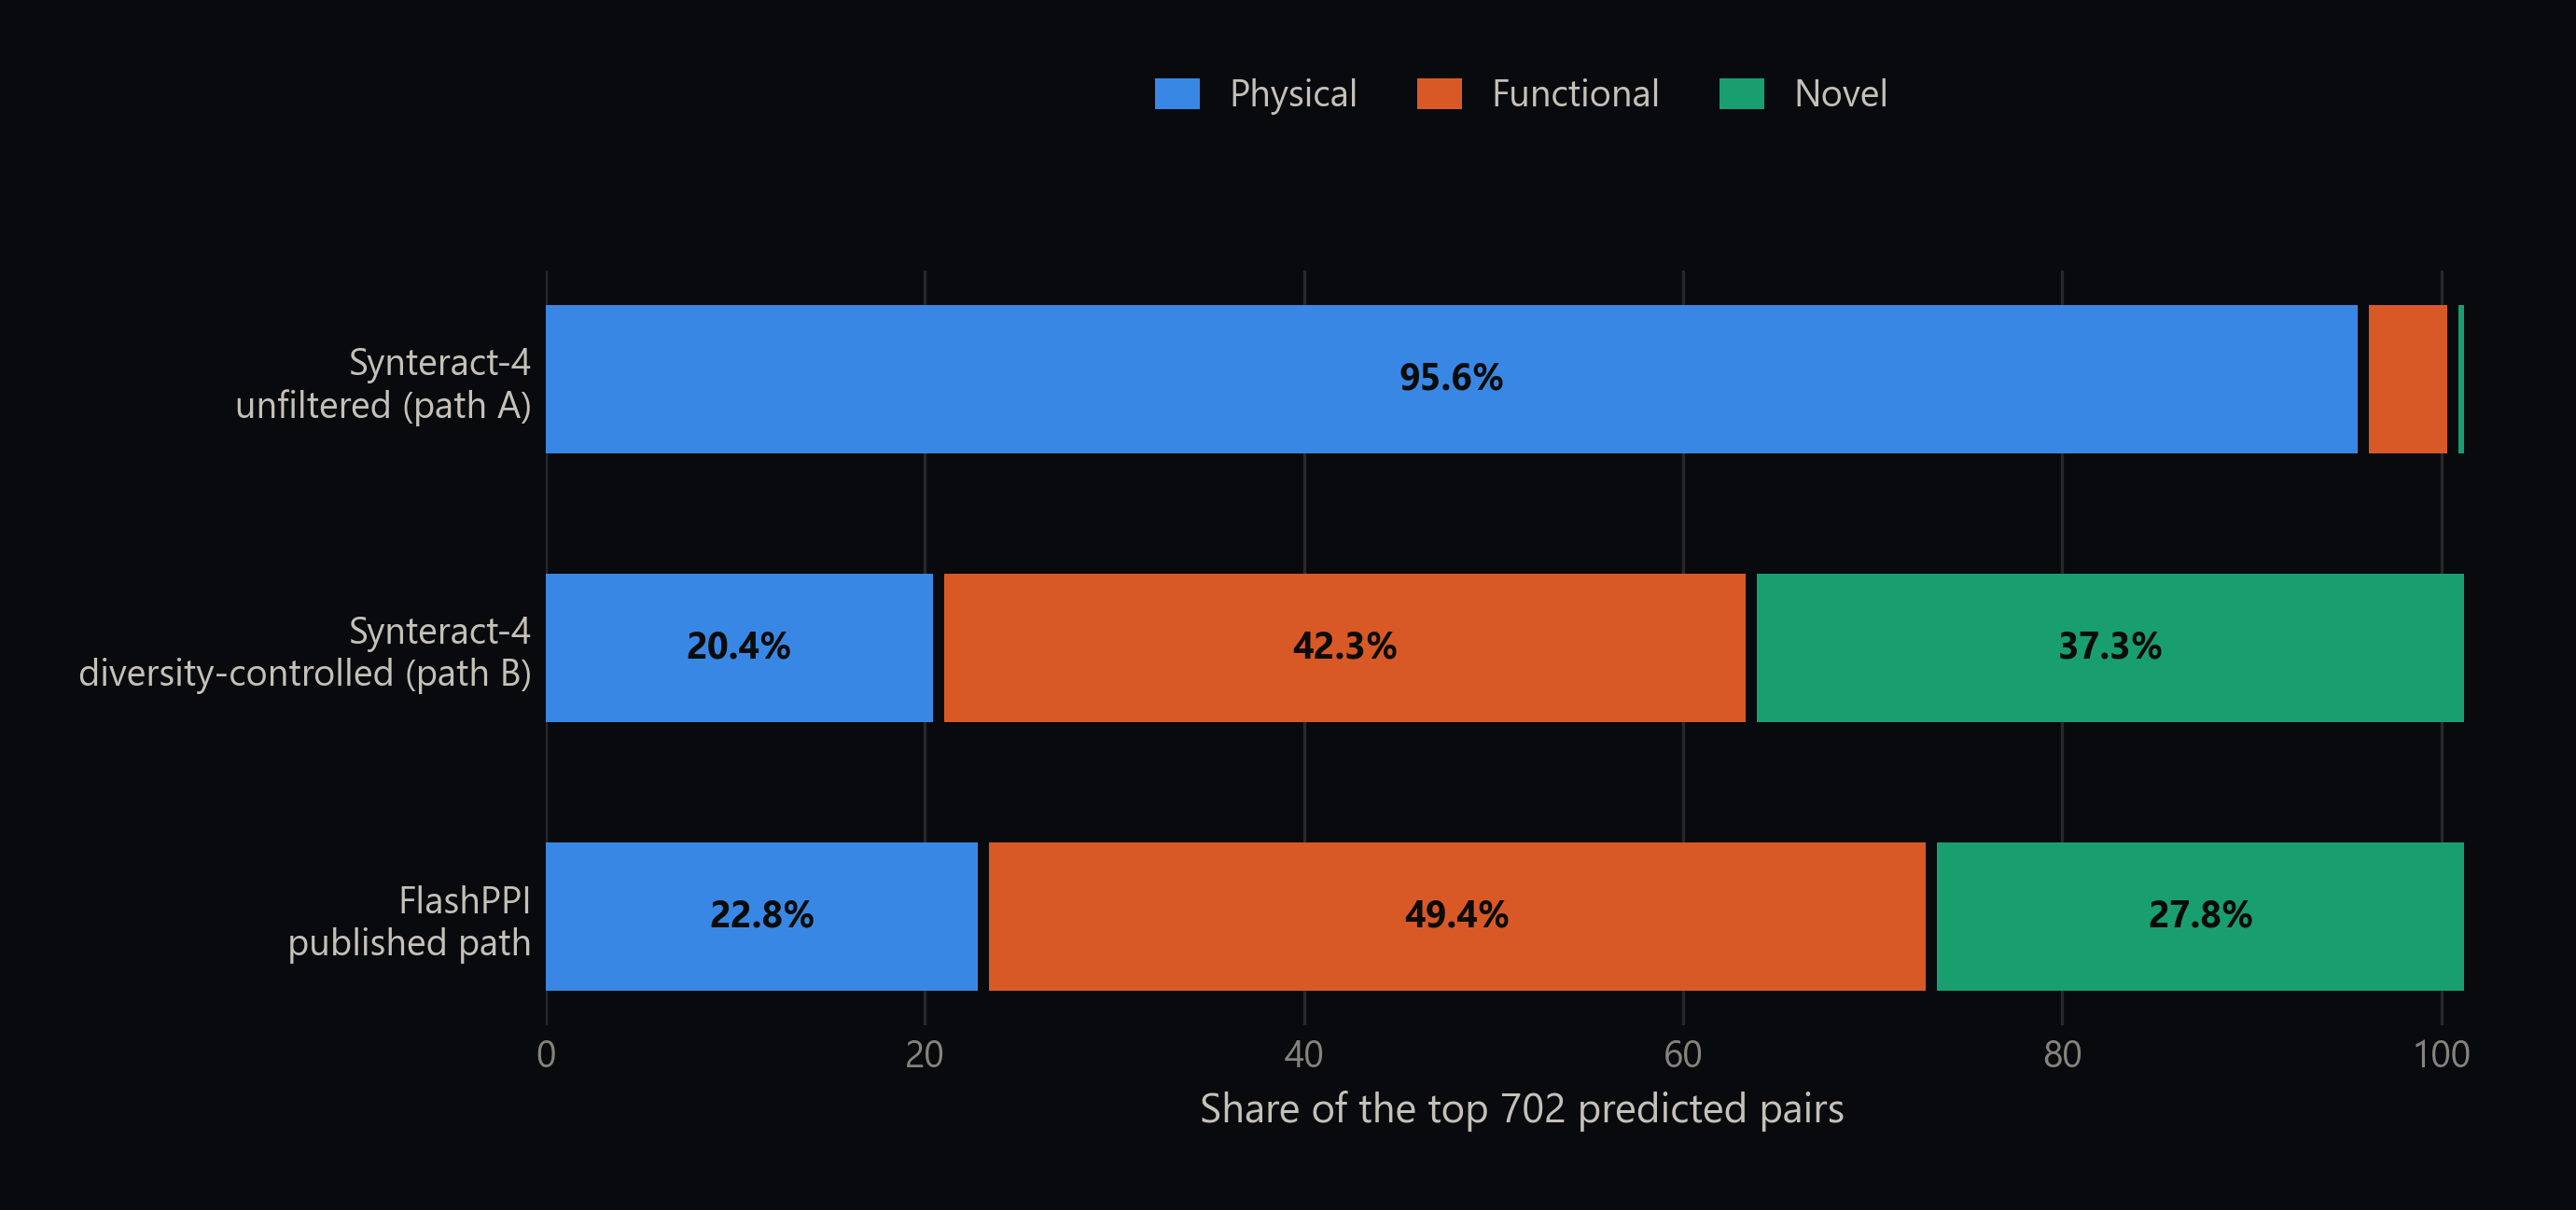
(b) Unfiltered, the top of the list is almost entirely known physical interactions. Under a diversity-controlled pipeline it looks much like FlashPPI's published breakdown.
Panel (a) says something reassuring about calibration: the model's confidence tracks evidence quality. As the positive set is narrowed from any-evidence to STRING combined score 700, precision-recall AUC rises from 0.356 to 0.602. The model is not merely finding pairs; it is finding the better-supported ones first.
Panel (b) is a caution. In the unfiltered top 702 E. coli pairs, 95.6 percent are already-known physical interactions and 0.3 percent are novel. That is a model rediscovering the textbook, which is the correct behavior for a sanity check and useless for discovery. Apply the diversity-controlled pipeline that FlashPPI uses, which retrieves the top 100 partners per protein and then filters hubs and homologs, and the mix shifts to 20.4 percent physical, 42.3 percent functional, and 37.3 percent novel.
What this does not show
"Novel" here means "absent from every STRING evidence channel." Without an orthogonal experiment we cannot separate a genuine discovery from a confident false positive. The category name describes the database, not the biology.
Across species, where nearly everything fails
Cross-species interaction is where published methods stop working. Szymborski and Emad benchmarked seven human-trained methods on human-SARS-CoV-2 labels and found all of them at chance.
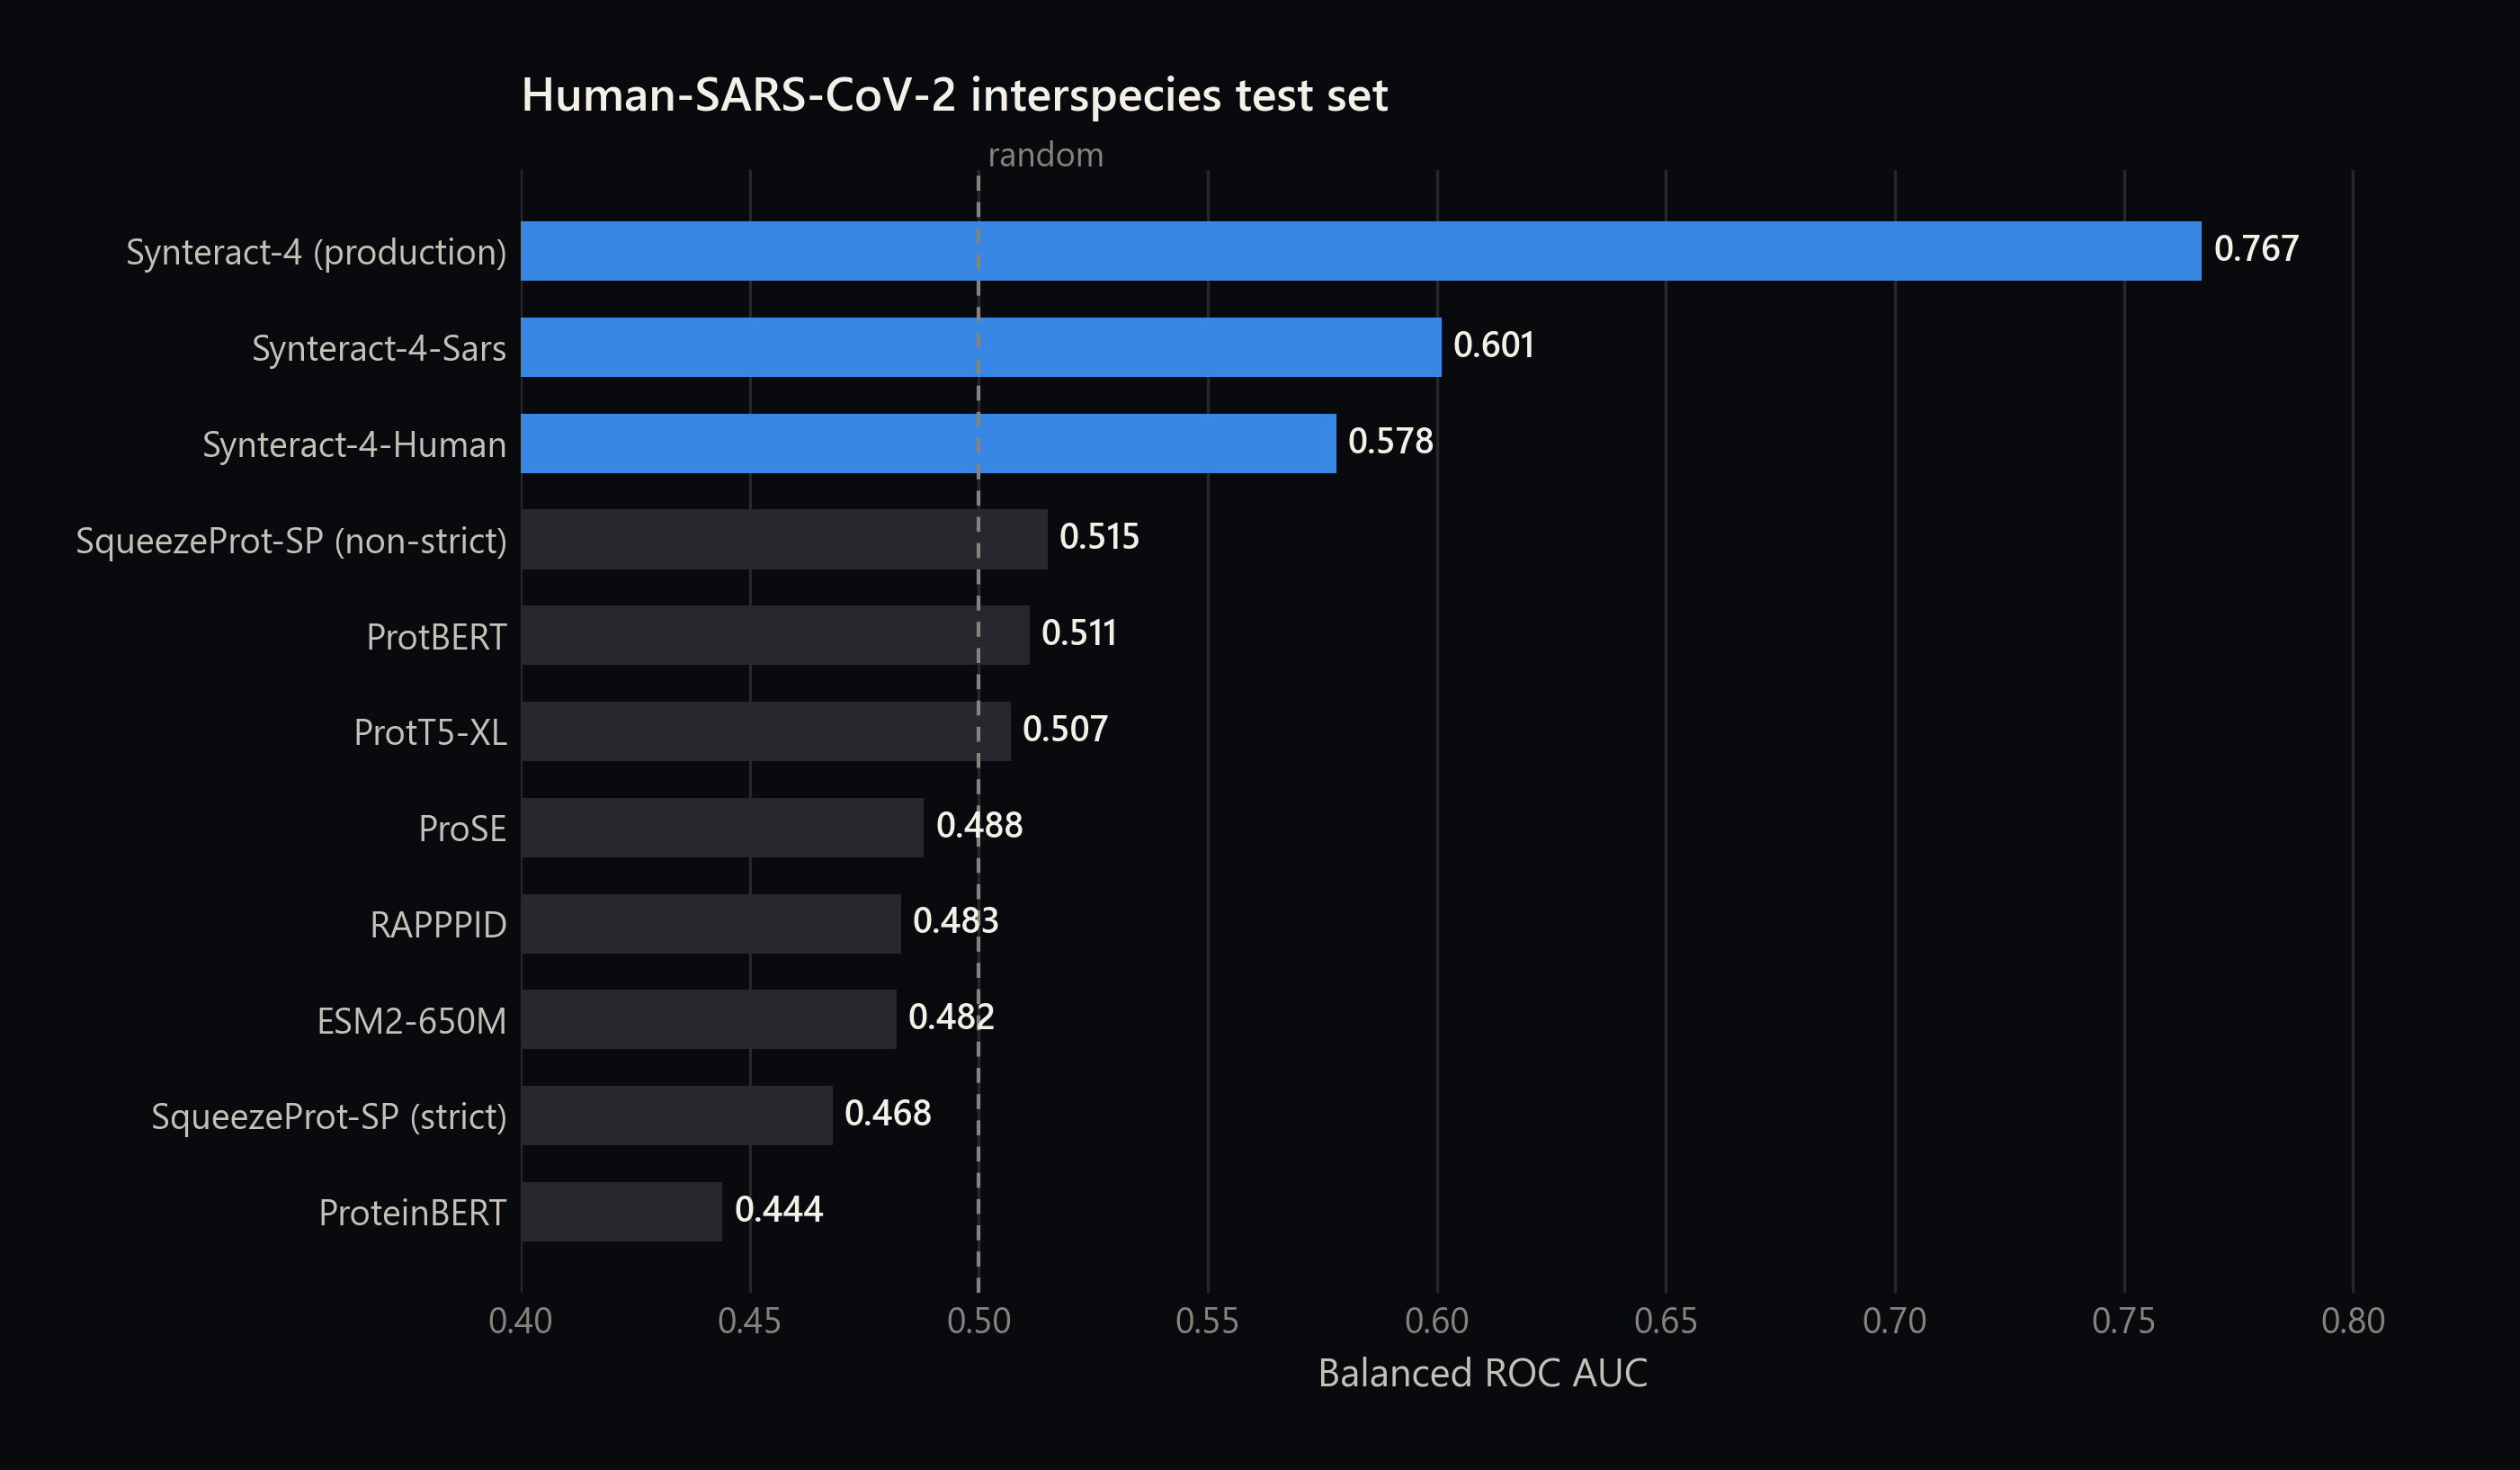
Synteract-4-Human, trained on human data only, reaches 0.58. The multi-species variant with a virus-side homology cut reaches 0.601. The production checkpoint reaches 0.767, but its training distribution was never given a SARS-CoV-2-specific homology cut and did include some human-virus examples, so that number should be read as an upper bound rather than a clean result.
A sequence-only model can clear the random floor on a controlled interspecies test where prior methods do not. It is not a solution to host-pathogen biology. Full-surface precision-recall AUC is still 0.038 for the controlled variant, because the real class balance is brutal.
A wet-lab anchor
Every number above is a comparison against a database. Databases encode what has been looked for, so a model that agrees with them may be agreeing with the field's attention rather than with biology. One orthogonal check sits outside the databases entirely.
The team measured cardiac HSP90 beta interaction partners by immunoprecipitation mass spectrometry across 24 human left-ventricular samples: six non-failing controls and three dilated-cardiomyopathy cohorts of six each. That produced 92 partners, 29 of which appear in none of the Picard curation, STRING, or BioGRID HSP90 beta partner sets.
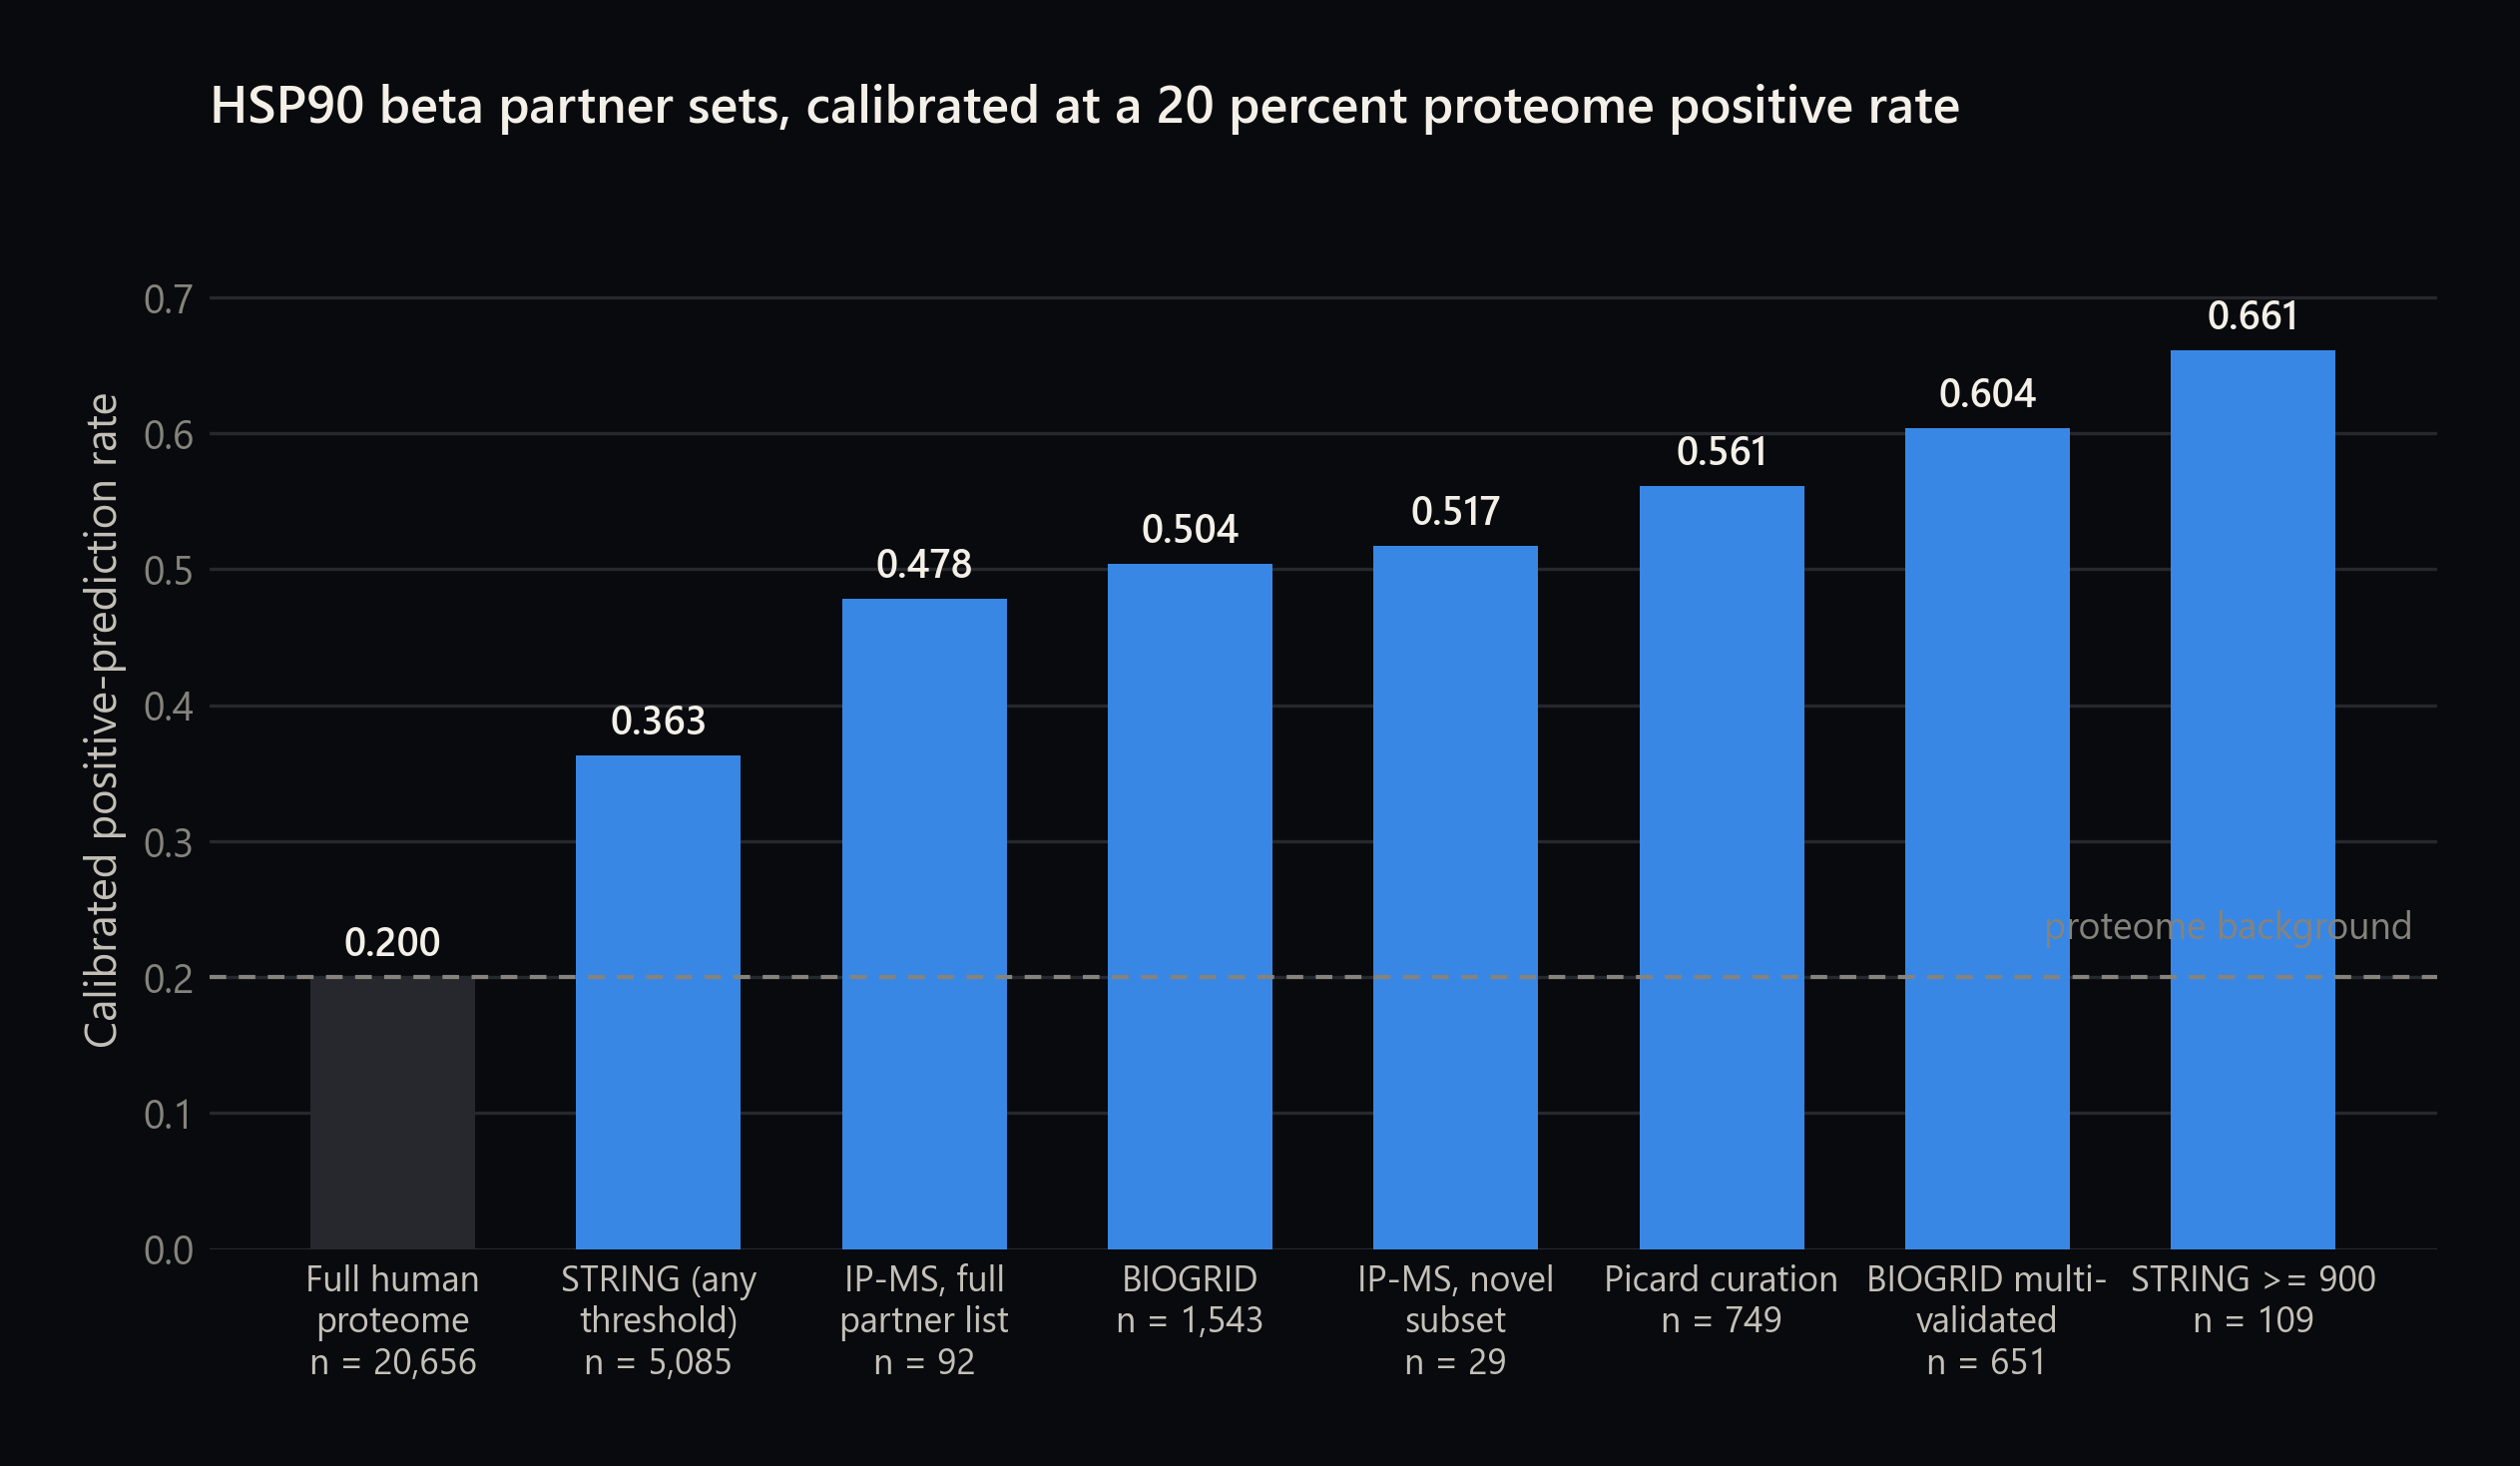
At that calibration the model calls 15 of the 29 novel partners positive, a rate of 0.517 against a 0.200 proteome background (two-proportion z of −4.26, p = 2.0 × 10⁻⁵). Among them are eleven histone H2A variants, cardiac troponin TNNT2, and the skeletal myosin MYH13, which carries the largest differential signal in the entire partner set at a log₂ fold change of +6.1 in the filamin-C cohort against non-failing controls.
The misses are as informative. The fourteen partners the model scores below 0.20 are dominated by immunoglobulin chains, non-cardiac keratins, and mitochondrial enzymes: exactly the classes a sequence-only model should be skeptical of as direct chaperone clients, and exactly the classes that show up in an immunoprecipitation for reasons other than direct binding. The one uncomfortable miss is cardiac troponin C, scored at 0.12 despite a 2.45-fold log₂ enrichment.
Terms used here
Where this sits in the Synteract line
Synteract-1 asked whether a protein language model could learn the interaction objective at all, and found that it could once the negatives were built carefully. Synteract-2 pushed toward affinity and binding-site prediction. Synteract-3 was an internal generation that was never released; it scored well on chaperone calibration and stalled on the leakage-controlled benchmark, which is a polite way of saying it taught us something and then stopped.
Synteract-4 changes the operating model rather than the question. It asks whether the representation itself can carry the score well enough to support fast, large screens, and it answers yes with the caveats above. The through-line across the whole line is the same lesson we keep relearning: on this task, how the data is built determines what the model learns at least as much as how the model is built.
The line continues past this paper. Atlas is the productized successor, retrained on a larger encoder and extended with ligand and annotation scoring, so where the two disagree on a shared benchmark that article reports its own numbers and this one reports the manuscript's.
Evidence boundary
Each model variant was trained with a single seed, so the run-to-run spread on the headline numbers is not bounded. The frozen encoder was pretrained on the natural protein universe, so the cluster-disjoint held-out analysis is a practical mitigation for leakage rather than a strict solution.
What survives those caveats: sequence-only embeddings make proteome-scale interaction search cheap enough to guide where the expensive experiments go.
Source
Preparing for journal submission.