 Synthyra
Research
9 min read
Atlas: Making Protein Screens Searchable
Atlas answers three questions from a protein sequence: what it interacts with, what small molecules it might bind, and what it probably does. This is what each lane scores on held-out data, and what happened when the whole thing was pointed at three real pathogens.
Logan Hallee
October 10, 2025
Proteins are difficult to study one at a time because they rarely behave one at a time. They bind, recruit, block, localize, stabilize, and modify each other. A disease phenotype is usually not a single molecule misbehaving. It is a set of relationships that has shifted.
That is the scale Atlas is built for. A proteome of 20,000 proteins holds roughly two hundred million possible pairs before you add pathogen proteins, designed sequences, small molecules, or annotations. At that size the useful output is not a score. It is a map that tells you which corner of the search space deserves attention.
Three questions, one input
Atlas-PPI scores whether two proteins are likely to interact. It runs on a single pair, on a neighborhood around a query protein, or as an all-versus-all screen across a whole proteome.
Atlas-PLI scores whether a protein and a small molecule are likely to associate. In practice that means pointing a target at a compound library, including the 2,638 FDA-approved small molecules used in the screens below.
Atlas-CAMP connects a sequence to structured functional annotation space, so an interaction or ligand hypothesis arrives with functional context attached rather than floating on its own.
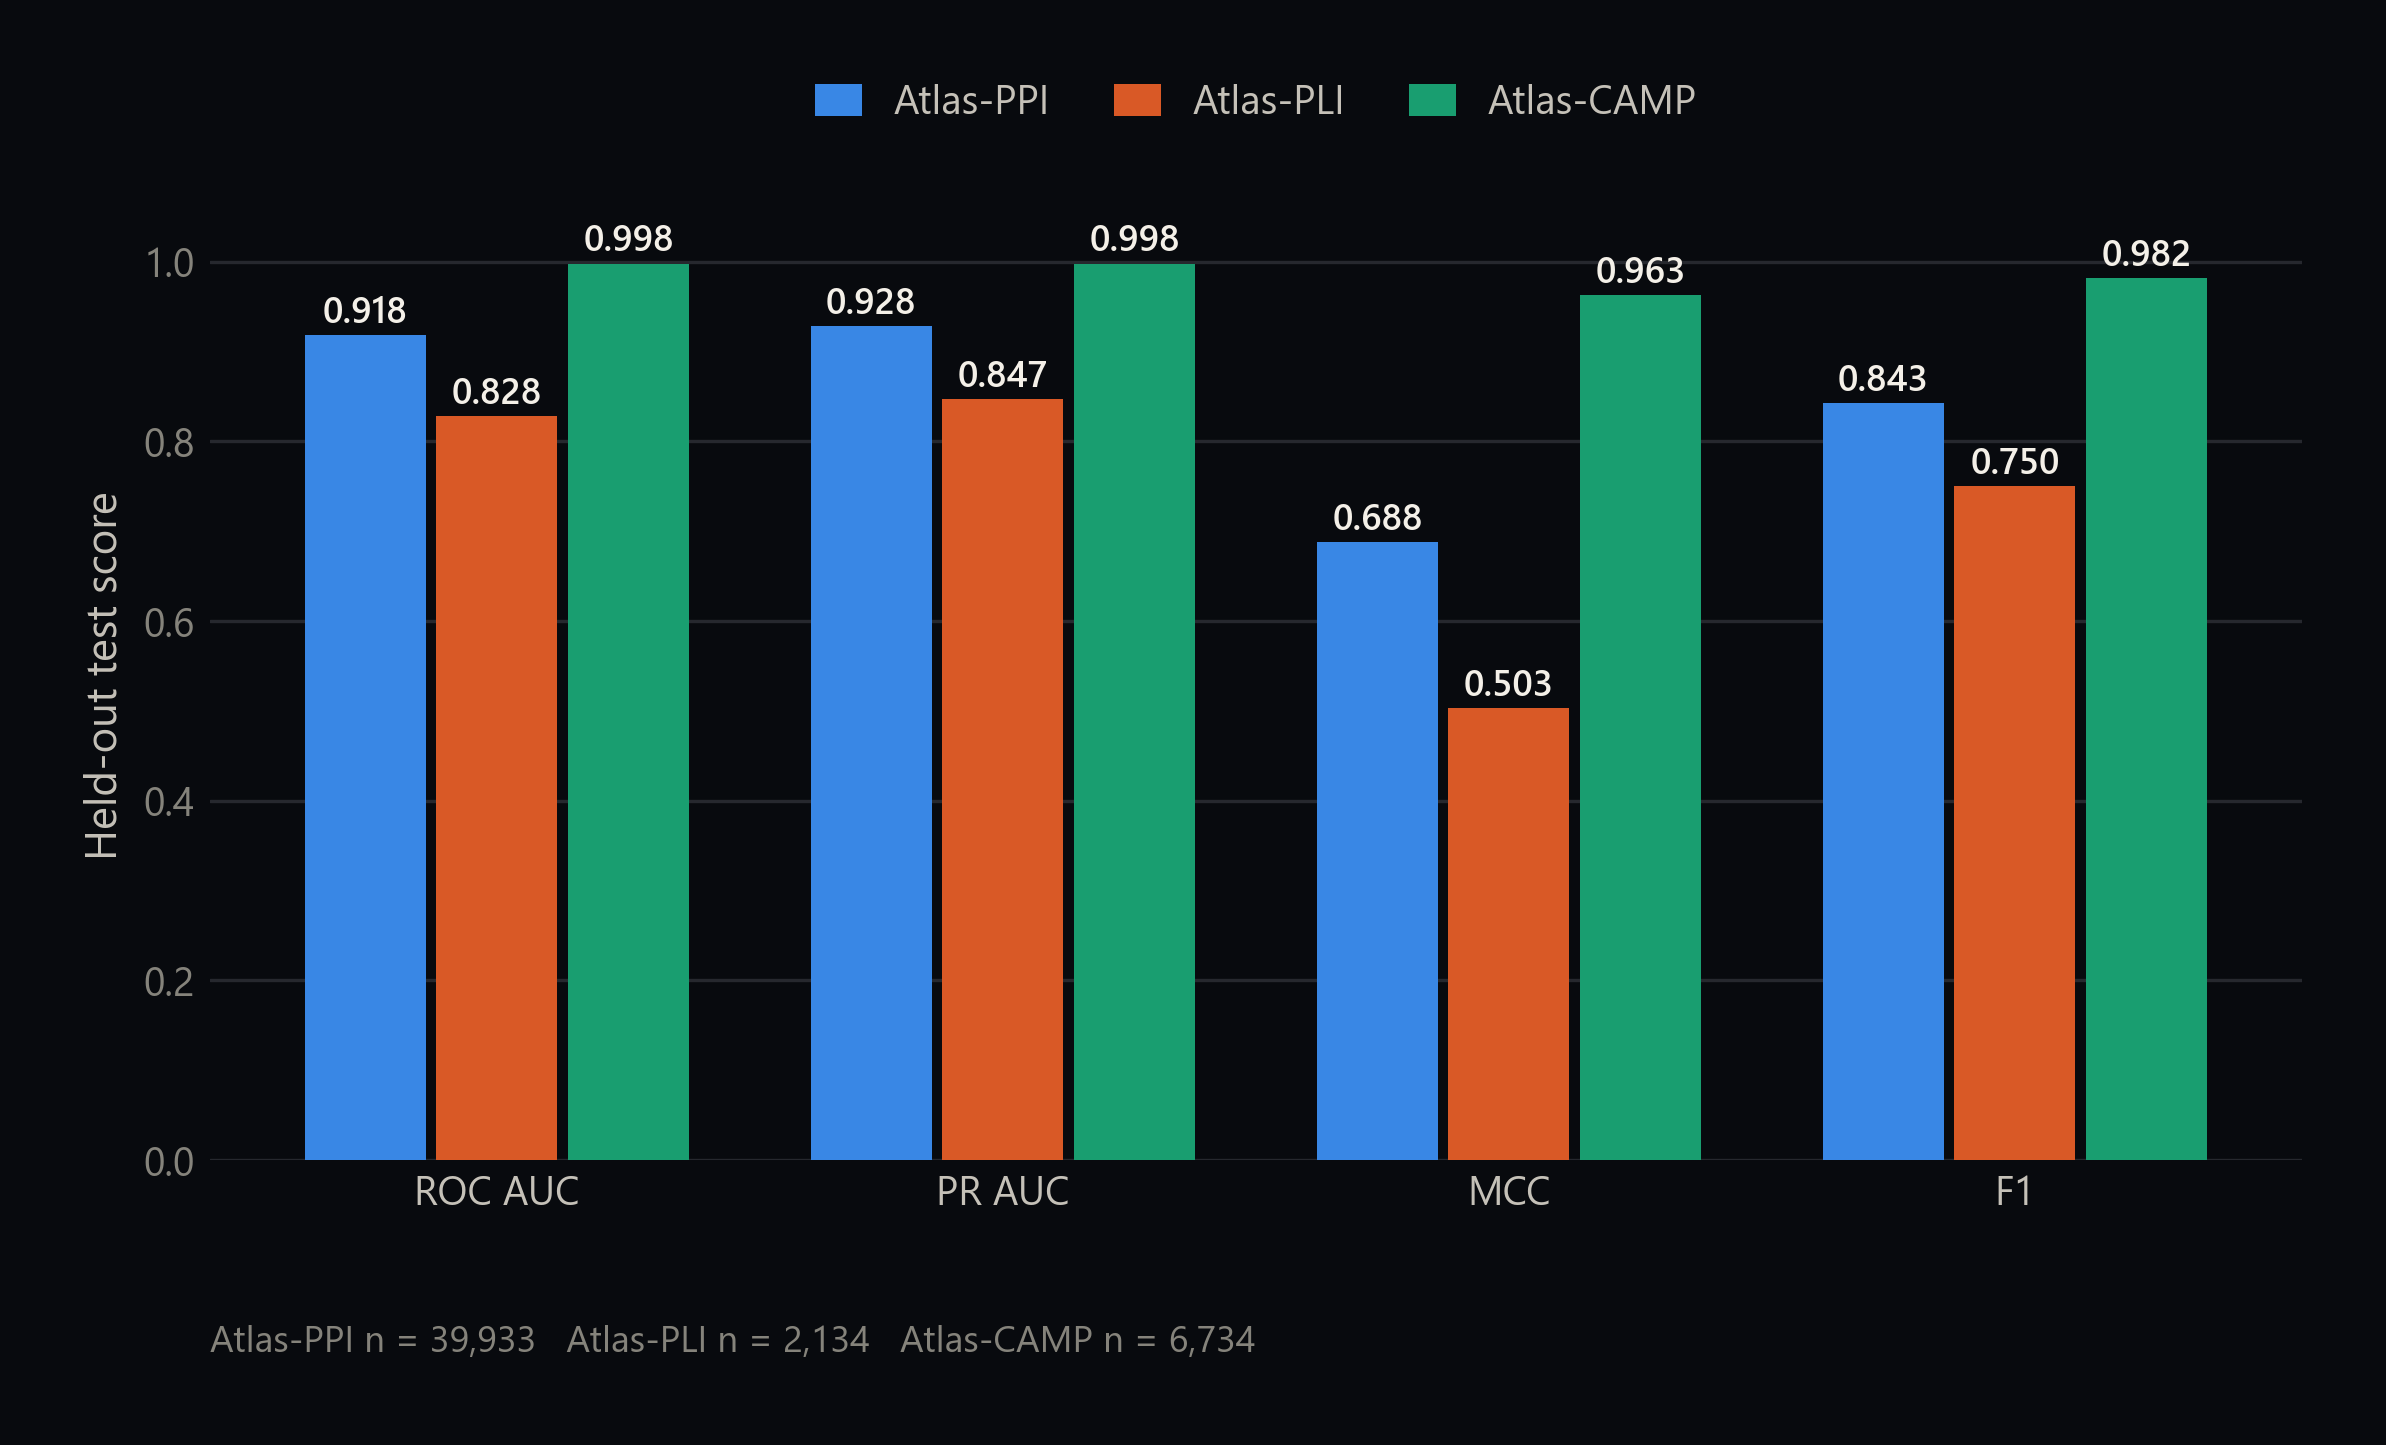
Two numbers in Figure 1 stand out.
Atlas-CAMP's test MCC of 0.963 looks implausible next to the other two, and it is not a mistake. Connecting a sequence to the functional vocabulary that describes it is a much easier problem than predicting a physical interaction, because function is heavily correlated with sequence family and interaction is not. The CAMP number says the annotation lane is reliable. It does not say the annotation lane is doing something hard.
Atlas-PLI is the weakest lane and also the one that moves most between splits: MCC of 0.682 on validation against 0.503 on test. That gap is a generalization warning, and it is the reason the ligand results later in this article are always paired with an independent structural check rather than reported on their own.
In plain terms
Think of the three lanes as three questions you can ask about a protein you have never seen before. Who does it touch? What might stick to it? And what is it probably for? None of the answers is a measurement. All three narrow what you would otherwise have to test blind.
Why the whole proteome fits
The reason Atlas can be pointed at every pair rather than a shortlist is throughput, and throughput on this task is not a rounding difference.
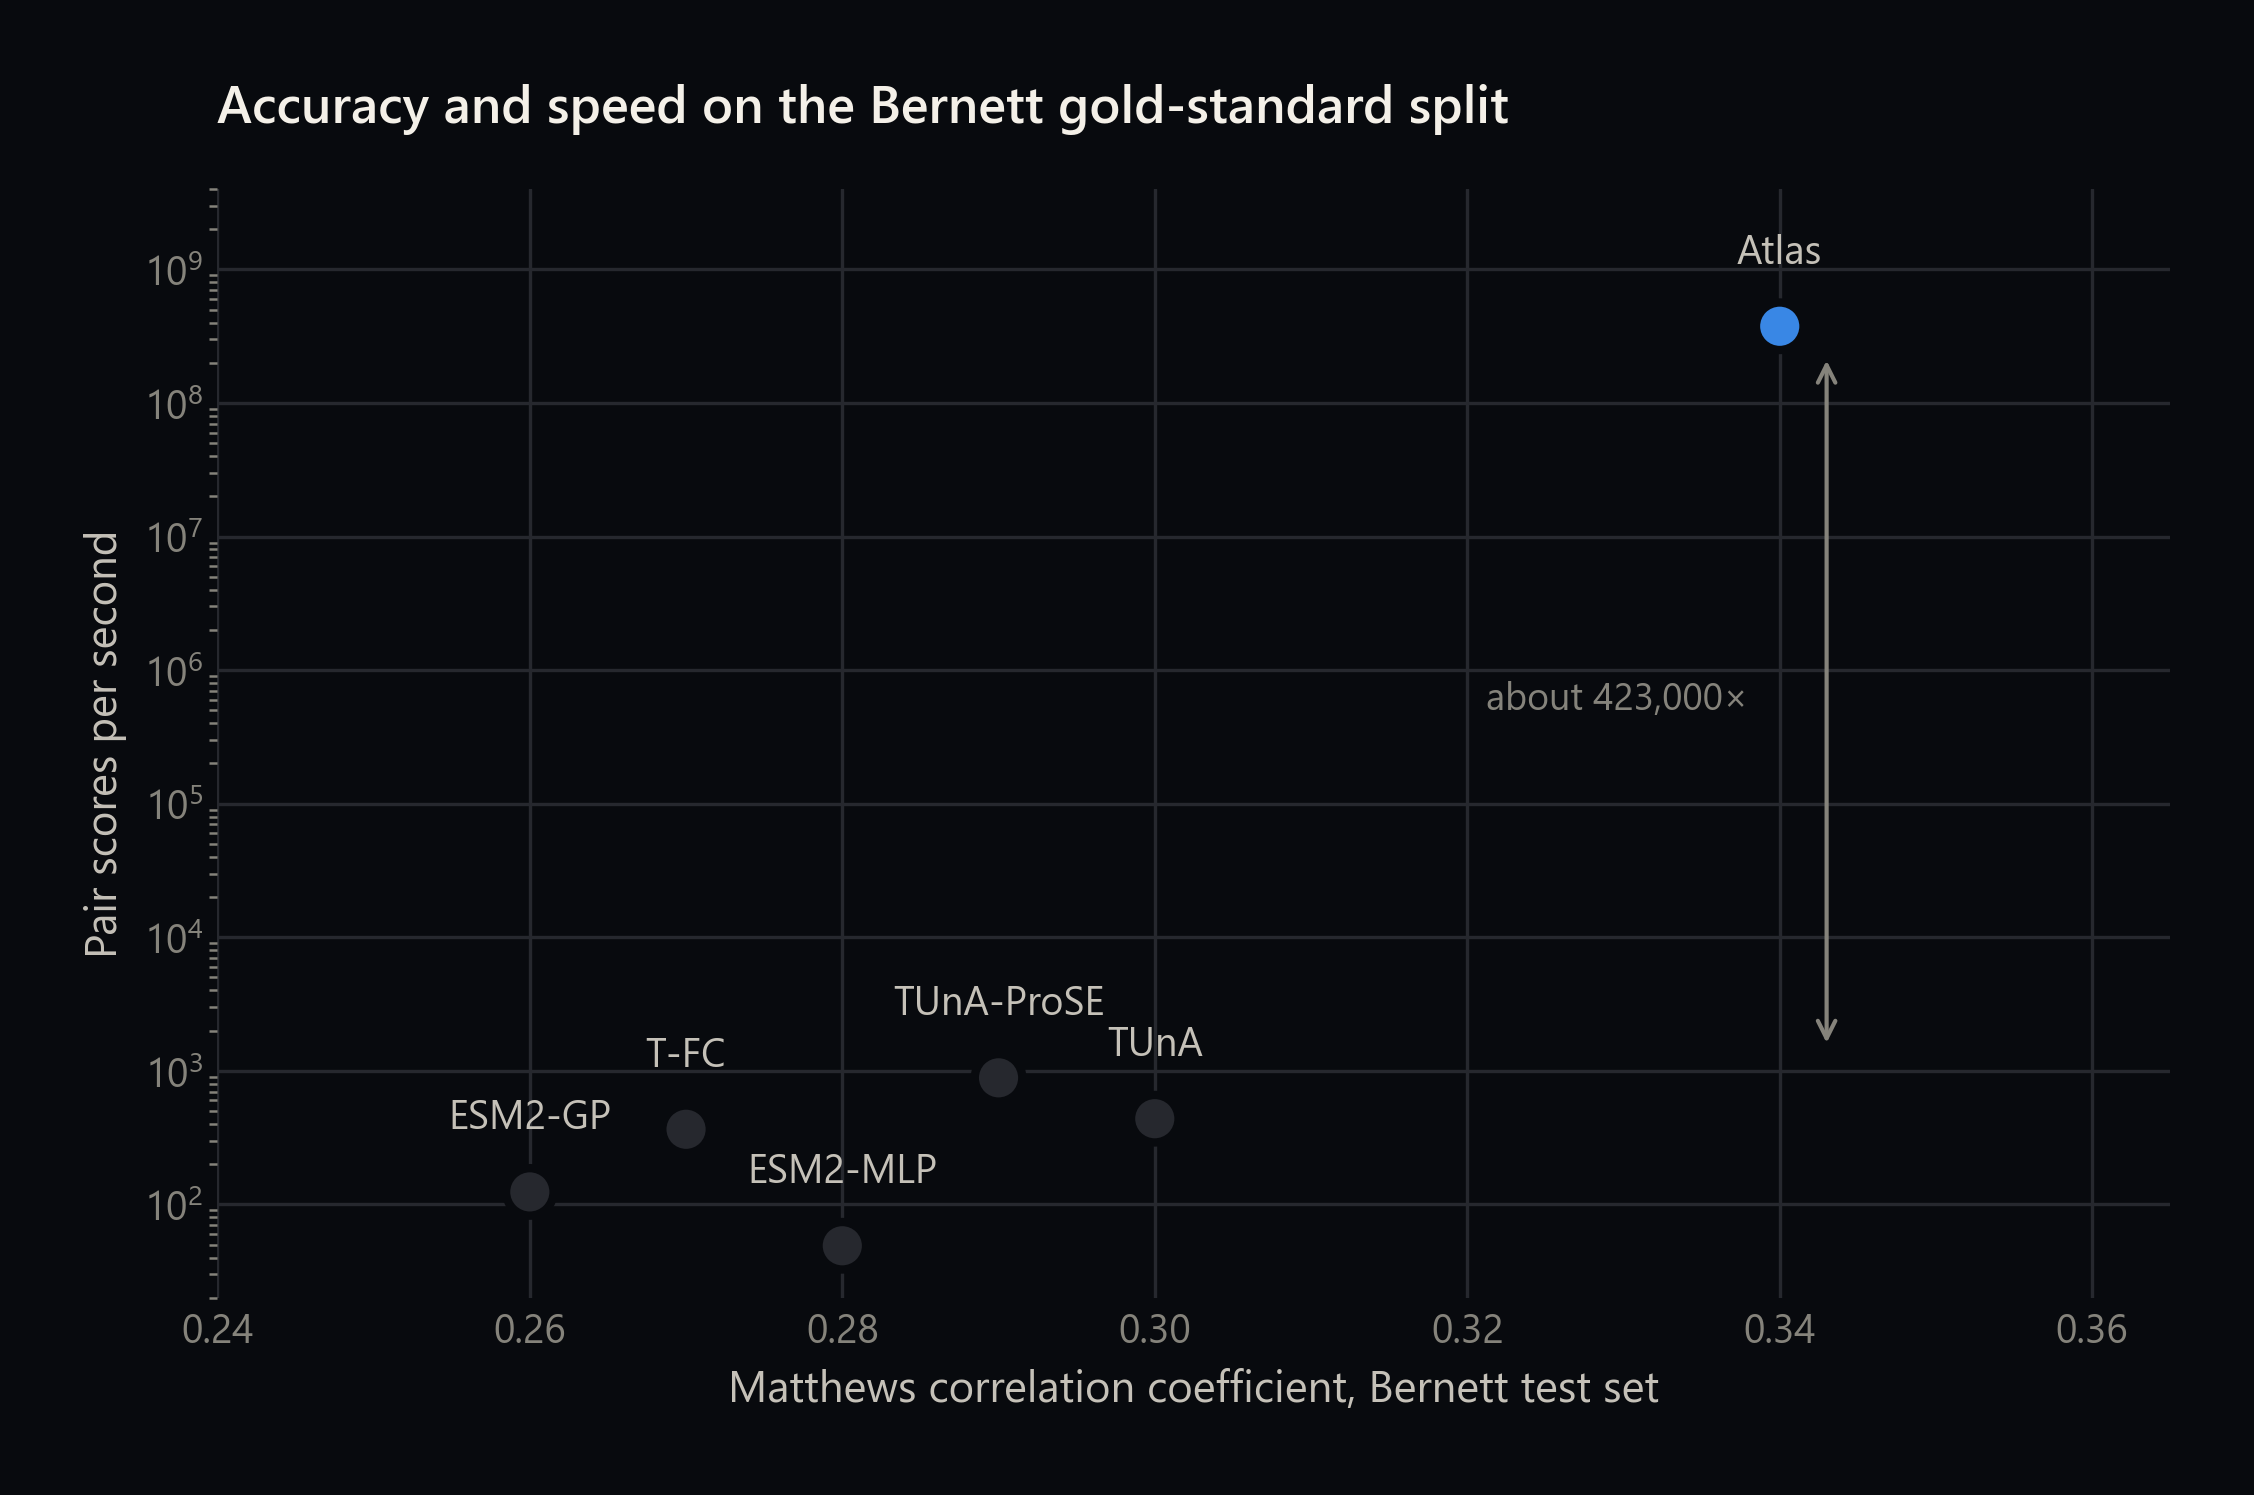
Atlas reaches an MCC of 0.34 on that split, the highest reported, with the next best published method at 0.30. The interesting part of Figure 2 is the vertical axis. At roughly 375 million pair scores per second after sequences are encoded, Atlas is about five orders of magnitude faster than the quickest comparator that publishes a rate at all.
Everything below rests on that vertical axis. The Synteract-4 article works through why the cost curve has this shape; the consequence is that a screen stops being something you budget for and becomes something you run while deciding what to ask next. Both of the outbreak case studies below finished in under a minute, and neither was a shortlist.
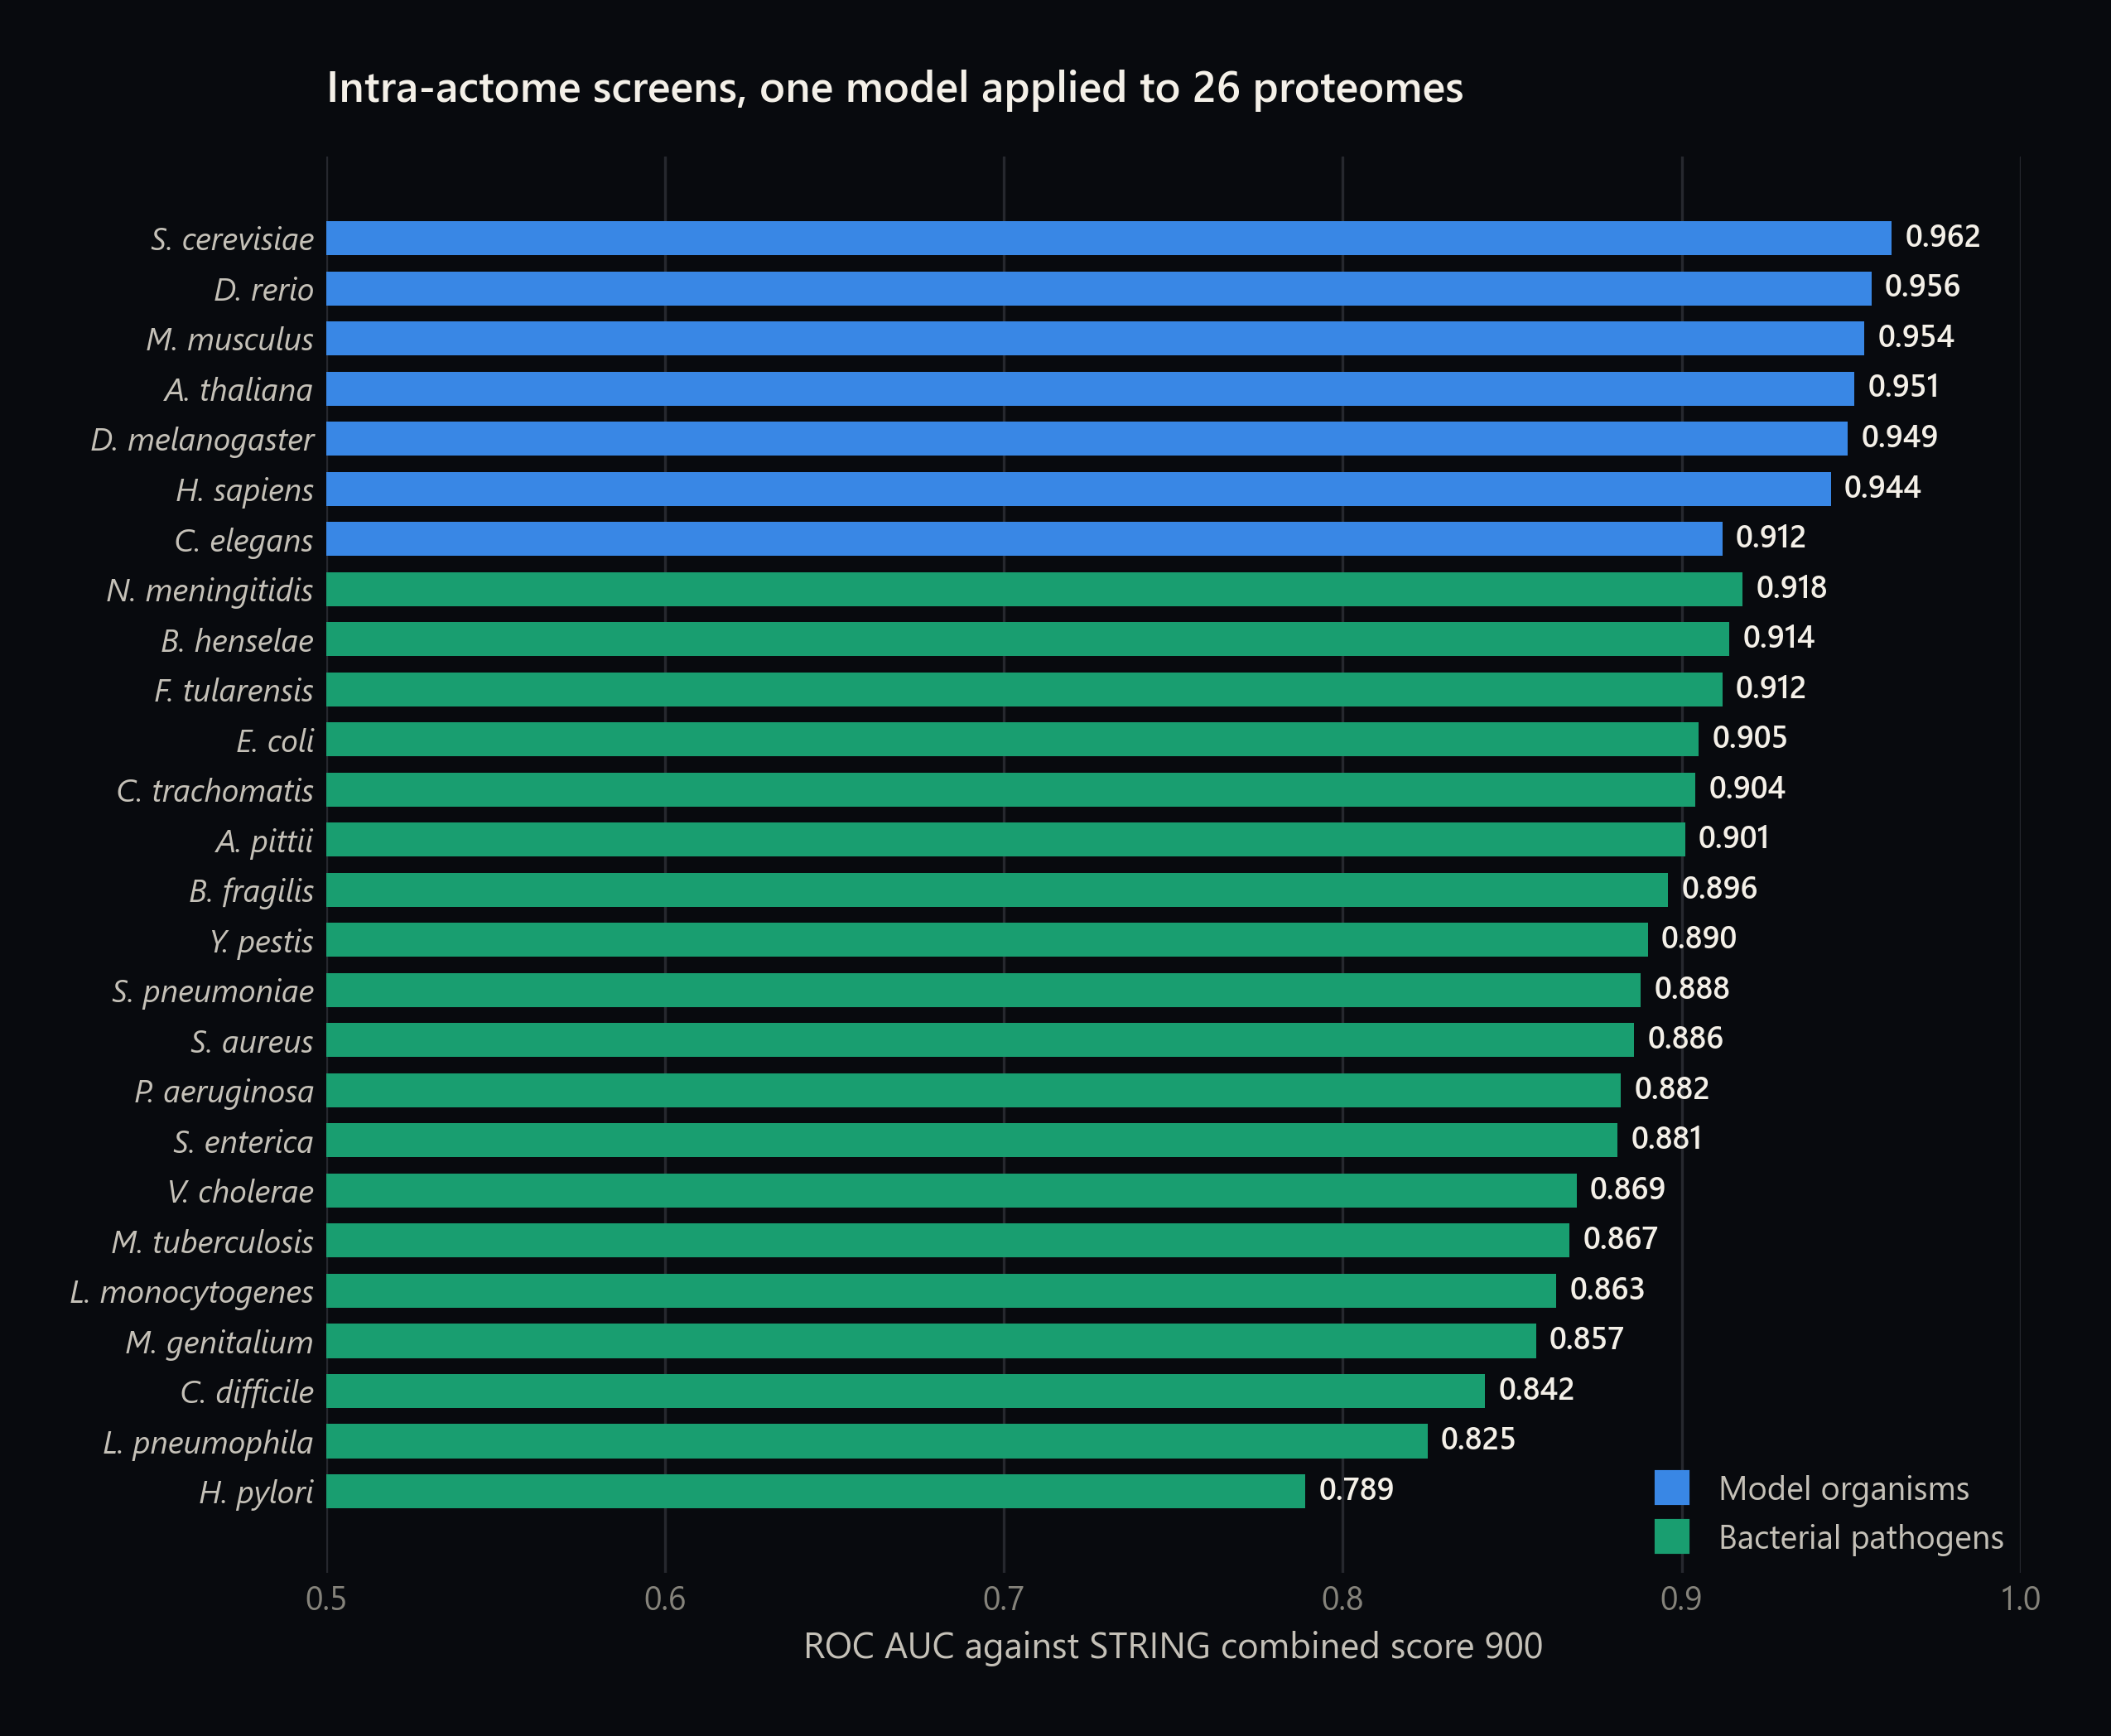
Figure 3 is the coverage claim. The same checkpoint that scores yeast at 0.962 scores Helicobacter pylori at 0.789, and nothing was adapted between those two runs. The spread is real: the organisms at the bottom are the ones with the thinnest STRING evidence, so part of what the low end measures is how much ground truth exists to be right about.
What happens on a pathogen nobody trained for
Cross-species interaction is the hardest surface in this field. A 2026 audit in Nature Machine Intelligence scored eight previously published methods on human-SARS-CoV-2 labels and found every one of them indistinguishable from chance, in a band from 0.444 to 0.515 ROC AUC.
On a homology-controlled human-SARS-CoV-2 test set, Atlas trained on human data alone reaches 0.645, and the production checkpoint reaches 0.790. Clearing the random floor where prior methods do not is a real result, and it is a long way from solved. The full-surface precision-recall AUC is still low, because the real class balance is brutal.
That capability is what the three case studies in our host-pathogen report test on pathogens with active outbreaks. Two of them appear below.
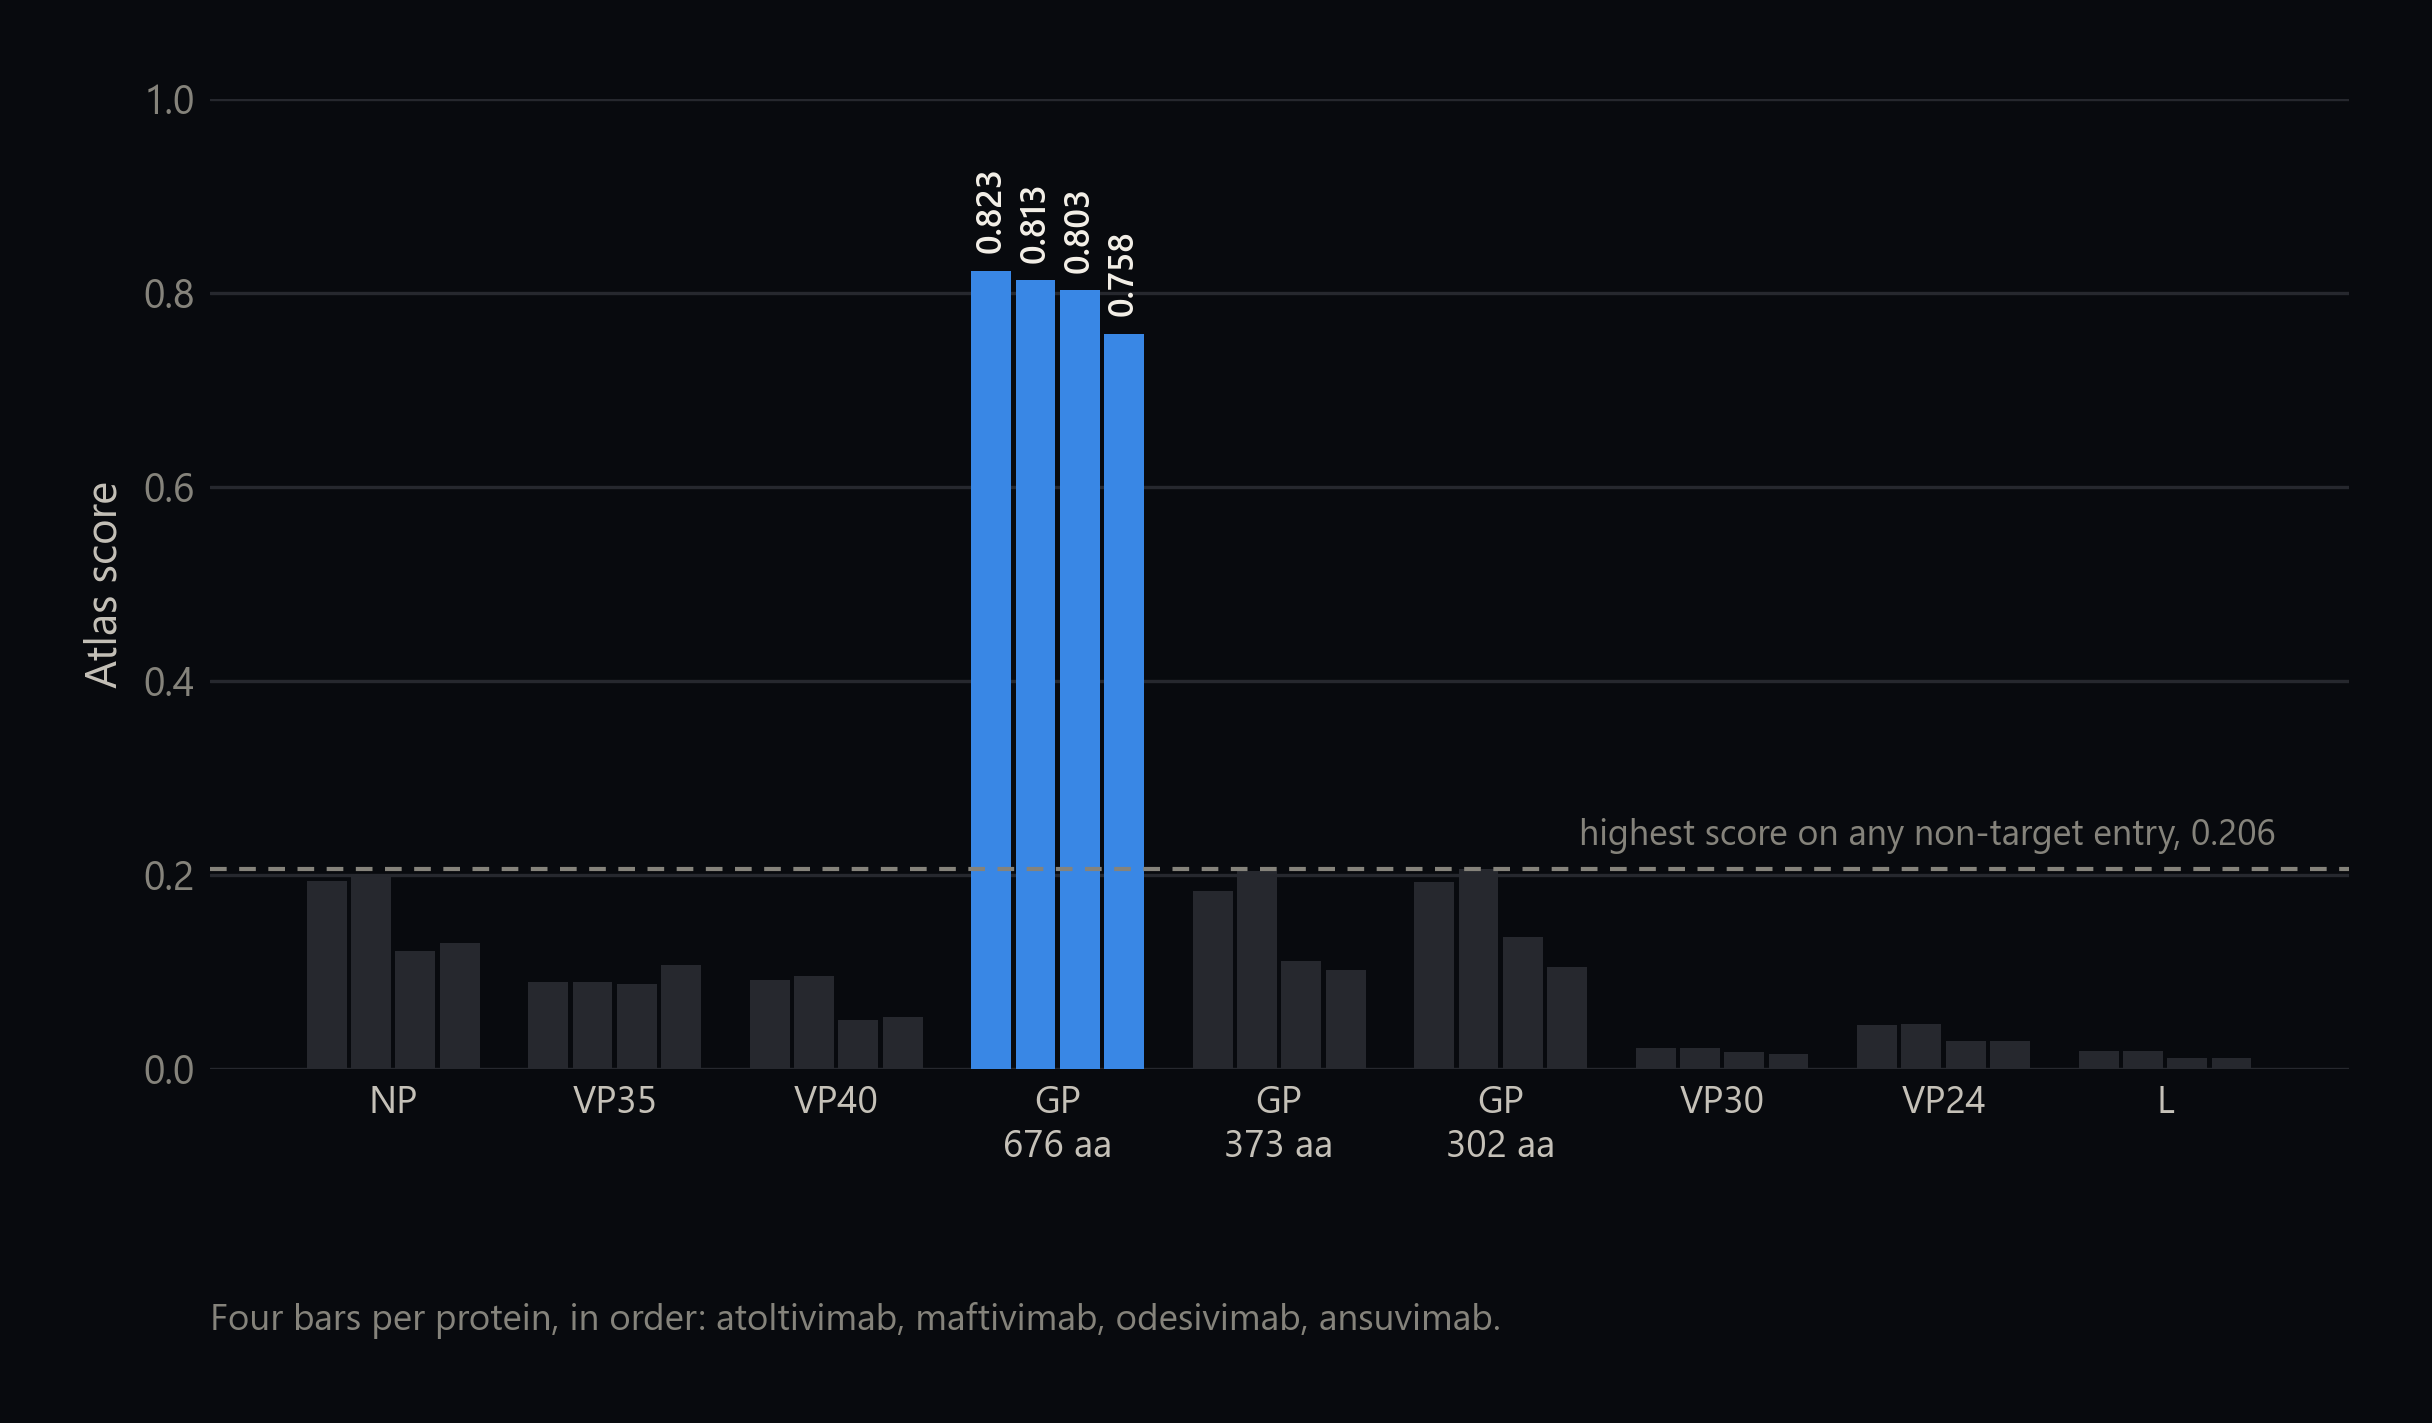
(a) Every one of the four approved antibodies lands between 0.758 and 0.823 on full-length glycoprotein, their actual target, and no higher than 0.206 on any of the eight non-target entries, which are the six non-GP proteins plus the two shorter products of the GP gene. The model was given no target annotation.
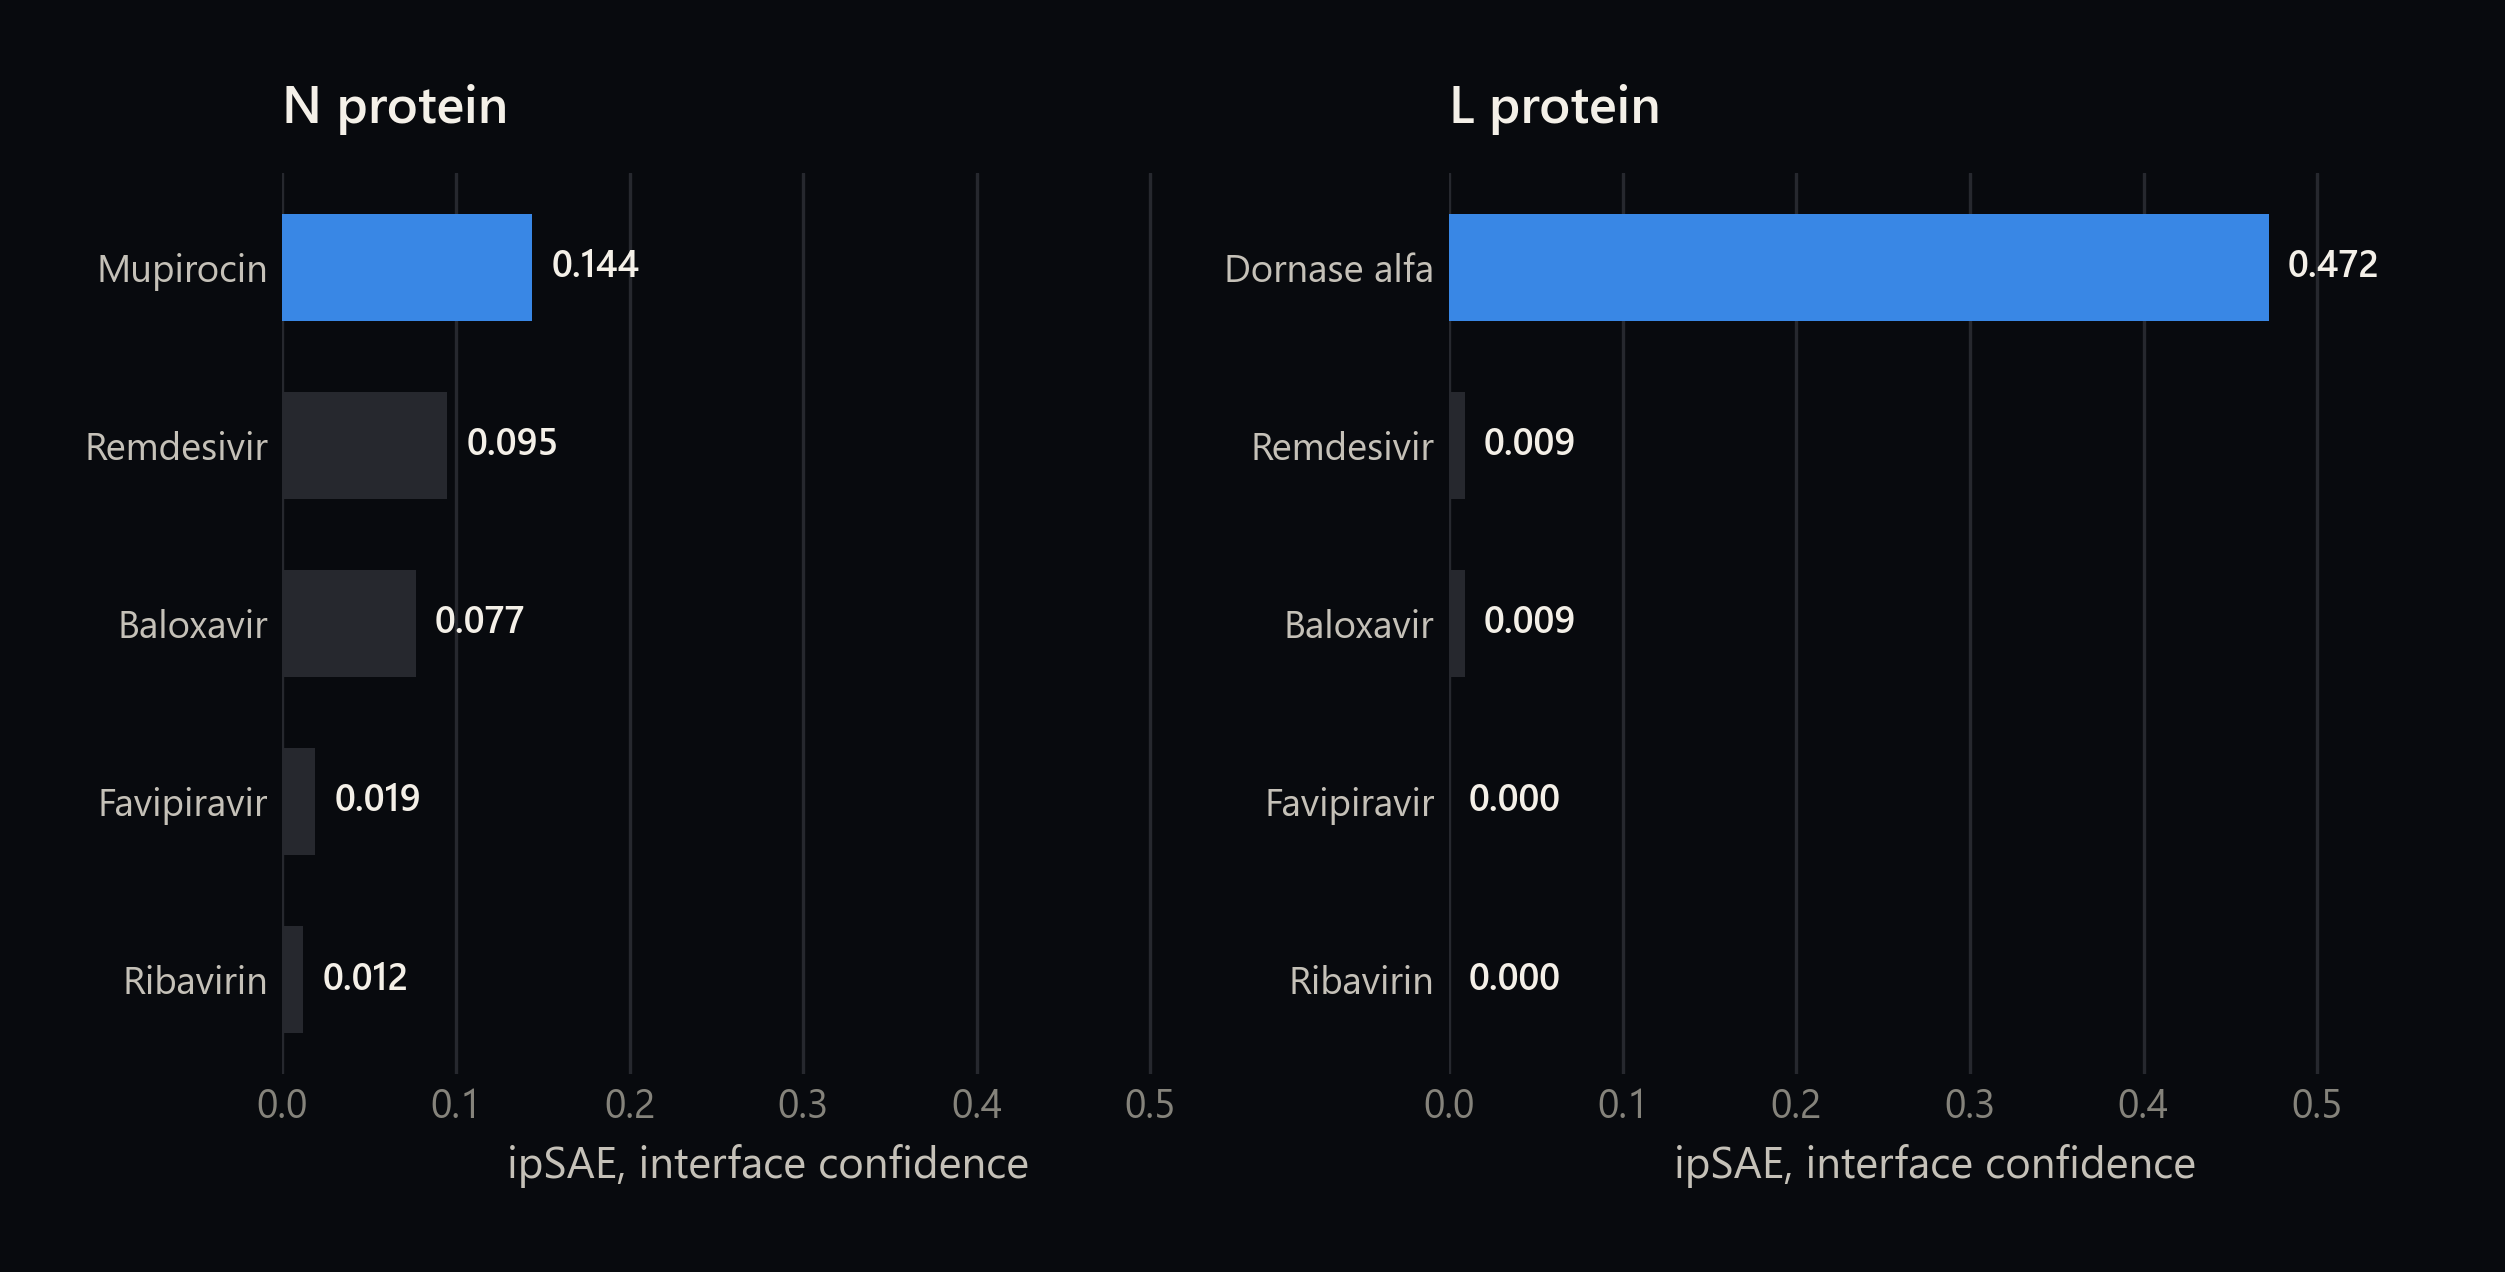
(b) Interface confidence from an independent folding model, for the Atlas-nominated candidate against the four antivirals with documented hantavirus activity. Mupirocin and dornase alfa both score above every benchmarked antiviral on their target.
The ebolavirus screen is the cleaner test, because the answer was known in advance and withheld from the model. Four FDA-approved monoclonal antibodies bind ebolavirus glycoprotein and nothing else in the viral proteome. Scored against all nine Bundibugyo proteins, Atlas separated the correct antigen completely across all thirty-six comparisons, with a 3.7-fold margin and no overlap. It also split the three products of the GP gene, scoring only the full-length form that carries the surface these antibodies engage. The whole screen, including the 19,933-protein human proteome and both FDA drug libraries, took 60.3 seconds.
The production checkpoint carries no filovirus homology holdout, so the antibodies and their antigen may both sit in its training corpus. The screen withheld the target annotation, not the sequences, which makes this a measurement of retrieval rather than of discovery. The held-out protocol used for the SARS-CoV-2 case study is the control that would change that.
The hantavirus screen ran in 33 seconds against three viral proteins, and nominated two candidates that have been on the market for decades: mupirocin, a topical antibiotic approved in 1987, and dornase alfa, approved in 1993 and already delivered by nebulizer directly to the lung, which happens to be the organ hantavirus disease destroys. Both outscored every antiviral with documented hantavirus activity under an independent structure model.
What this does not show
These candidates are not validated therapeutics. They are interesting because a decades-old safety record makes them cheap to test.
Where the same screen fails
The ebolavirus case study also shows the failure modes, on the same run, with the same threshold.
The canonical filovirus entry receptor NPC1 scores 0.849 against glycoprotein, which puts it at rank 361 of 19,933 human proteins, in the top two percent and still below the 0.9 operating threshold. The attachment factor TIM-1 lands at rank 1,019. Both are found and both are discarded by a threshold inherited from much larger screens.
VP24 is a straight miss. Its established mechanism, blocking nuclear import through three specific karyopherins, is supported by a co-crystal structure, and Atlas places all three of those partners in the bottom sixty percent of the human proteome. What it returns instead is the adjacent compartment: the right transport machinery, the wrong molecular partners.
An independent folding cross-check does not corroborate the antibody result either. Ranked by interface confidence, that model puts the polymerase first and the correct antigen fifth of nine, and across 87 complexes the two scores are weakly anti-correlated. That folding pass was underpowered by construction, so we read it as a failed corroboration rather than a refutation, and we report it because agreement between two methods is the thing that should gate an experiment.
Why the controls are part of the product
Protein interaction datasets are unusually rich in tempting shortcuts. A model can score well by learning taxonomy, homology, subcellular localization, or the recipe used to build the dataset, instead of learning interaction biology.
We know this because we have run into it twice in our own work. Synteract-1 found that widely used compartment-derived interaction datasets could be partly solved with two crude features per protein and a support vector machine. The accidental taxonomist work found that in multi-species datasets, 96.5 percent of positives share a species while randomly shuffled negatives do so only 31.8 percent of the time. That gap is enough that a model detecting nothing but "same species?" scores 0.82 AUROC.
So Atlas inherits controls rather than benchmarks: same-species negatives where they apply, cluster-aware splits so no near-duplicate sequence spans a split boundary, homology filtering, and explicit interspecies evaluation.
These controls make every number in this article lower than it could be. That is what they are for. A screening surface built on a model that scored well by learning the dataset would produce a map of the dataset, not of the biology.
The research behind each lane
Atlas-PPI is the productized successor to Synteract-4, retrained on a larger encoder. The lineage runs back through Synteract-2, which added affinity and interface prediction, to Synteract-1 in 2023. Where the two generations disagree on a benchmark, this article uses the Atlas numbers and the Synteract-4 article uses its own.
Atlas-CAMP comes out of the Annotation Vocabulary work, which turned six biological ontologies into transformer tokens and found that three dollars of contrastive training bought better functional embeddings than models a thousand times its cost. The production model extends that foundation with broader annotation coverage and serving infrastructure.
Terms used here
Where this leaves the user
Atlas makes large biological search spaces searchable from sequence. It tells you which corner of a proteome, a drug library, or a host-pathogen interface to look at first, and it does so fast enough that the screen finishes before the experiment design meeting does.
The experiments still decide what is true. What changes is how well informed you are about where to point them.
Source
Atlas Host-Pathogen Interaction Report
Logan Hallee, Jason P. Gleghorn
Synthyra and the University of Delaware, June 2026. Case studies on SARS-CoV-2, Andes hantavirus, and Bundibugyo ebolavirus.