 Synthyra
Research
5 min read
Synteract-2: From Yes-or-No to How Strong and Where
Synteract-2 extends sequence-based interaction modeling to binding affinity and binding-site prediction, reaching lower error than dedicated affinity predictors and matching a structure model on interface residues.
Logan Hallee
April 22, 2025
Early interaction models ask one question: are these two proteins likely to interact? It is a reasonable question and it is rarely the one a researcher stops at.
If a pair might interact, the next questions arrive immediately. How strong is it? Which residues are involved? Is this worth the cost of a structural model or a binding assay? A binary label cannot rank a candidate list by anything except confidence, and confidence is not affinity.
Synteract-2 keeps the sequence-first premise from Synteract-1 and adds two quantitative outputs on top of it.
Predicting how strong
Binding affinity is usually reported as pKd, the negative logarithm of the dissociation constant. Because affinities span many orders of magnitude, working in log space means an error of 1.0 corresponds to being off by a factor of ten.
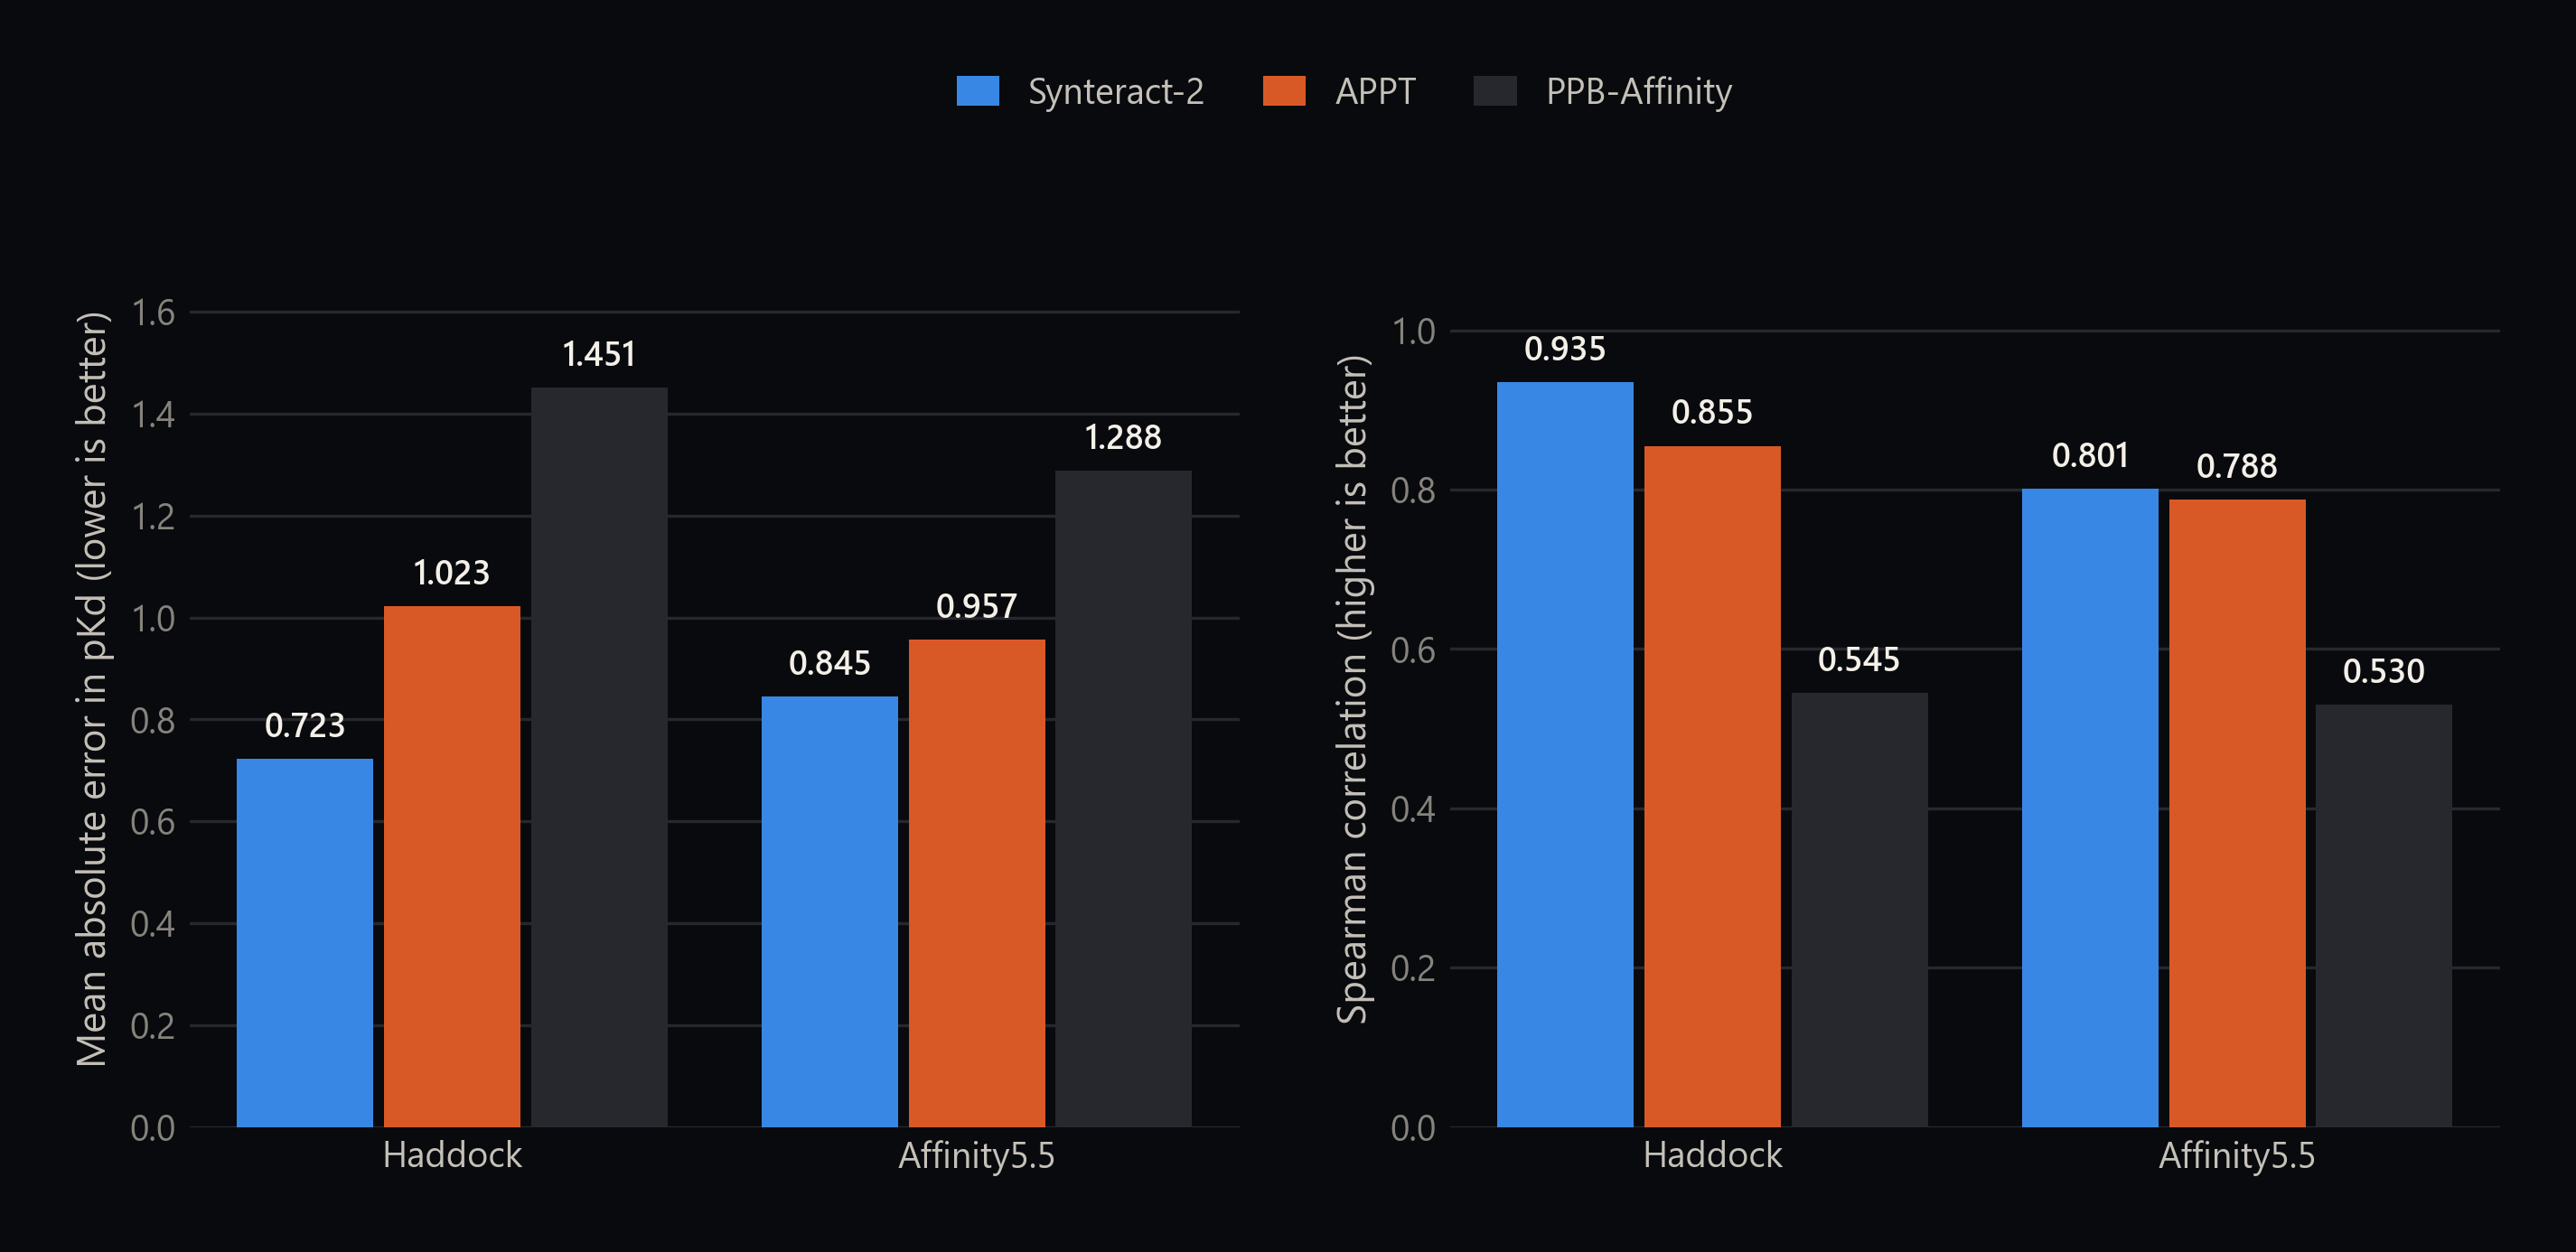
The evaluation uses two benchmarks. Haddock, trimmed to complexes where exactly two protein chains participate in the measurement, and Affinity5.5. The comparisons are APPT and PPB-Affinity, both dedicated protein-protein affinity predictors.
Haddock benchmark
0.723
Synteract-2 mean absolute error
pKd units; APPT reaches 1.023
0.935
Synteract-2 Spearman correlation
APPT reaches 0.855
0.545
PPB-Affinity Spearman
The weakest of the three on both benchmarks
The absolute error result is respectable: below one pKd unit on both benchmarks means the model is typically within a factor of ten of the measured value, which is coarse in absolute terms and usable for triage.
The correlation result matters more for how the model gets used. A Spearman correlation of 0.935 on Haddock means the ordering is largely right even where the absolute values drift. For a screening workflow that is the property you actually need, because the decision being made is which candidates to test next rather than what number to write down.
The gap between the two benchmarks is also informative. Haddock is smaller and cleaner; Affinity5.5 is larger and messier, and every model does worse on it. Synteract-2's advantage over APPT narrows there considerably, from a 0.30 pKd gap to 0.11. Benchmark difficulty compresses differences between methods, which is a reason to be wary of any ranking established on one dataset.
In plain terms
An affinity prediction is a guess at how tightly two proteins stick together, made without ever seeing them stick together. It is useful in the same way a weather forecast is useful: reliable enough to plan around, not reliable enough to bet the harvest on a single day.
Predicting where
Binding-site prediction is harder and more specific. Instead of one number per pair, the model must label individual residues as interface or not.
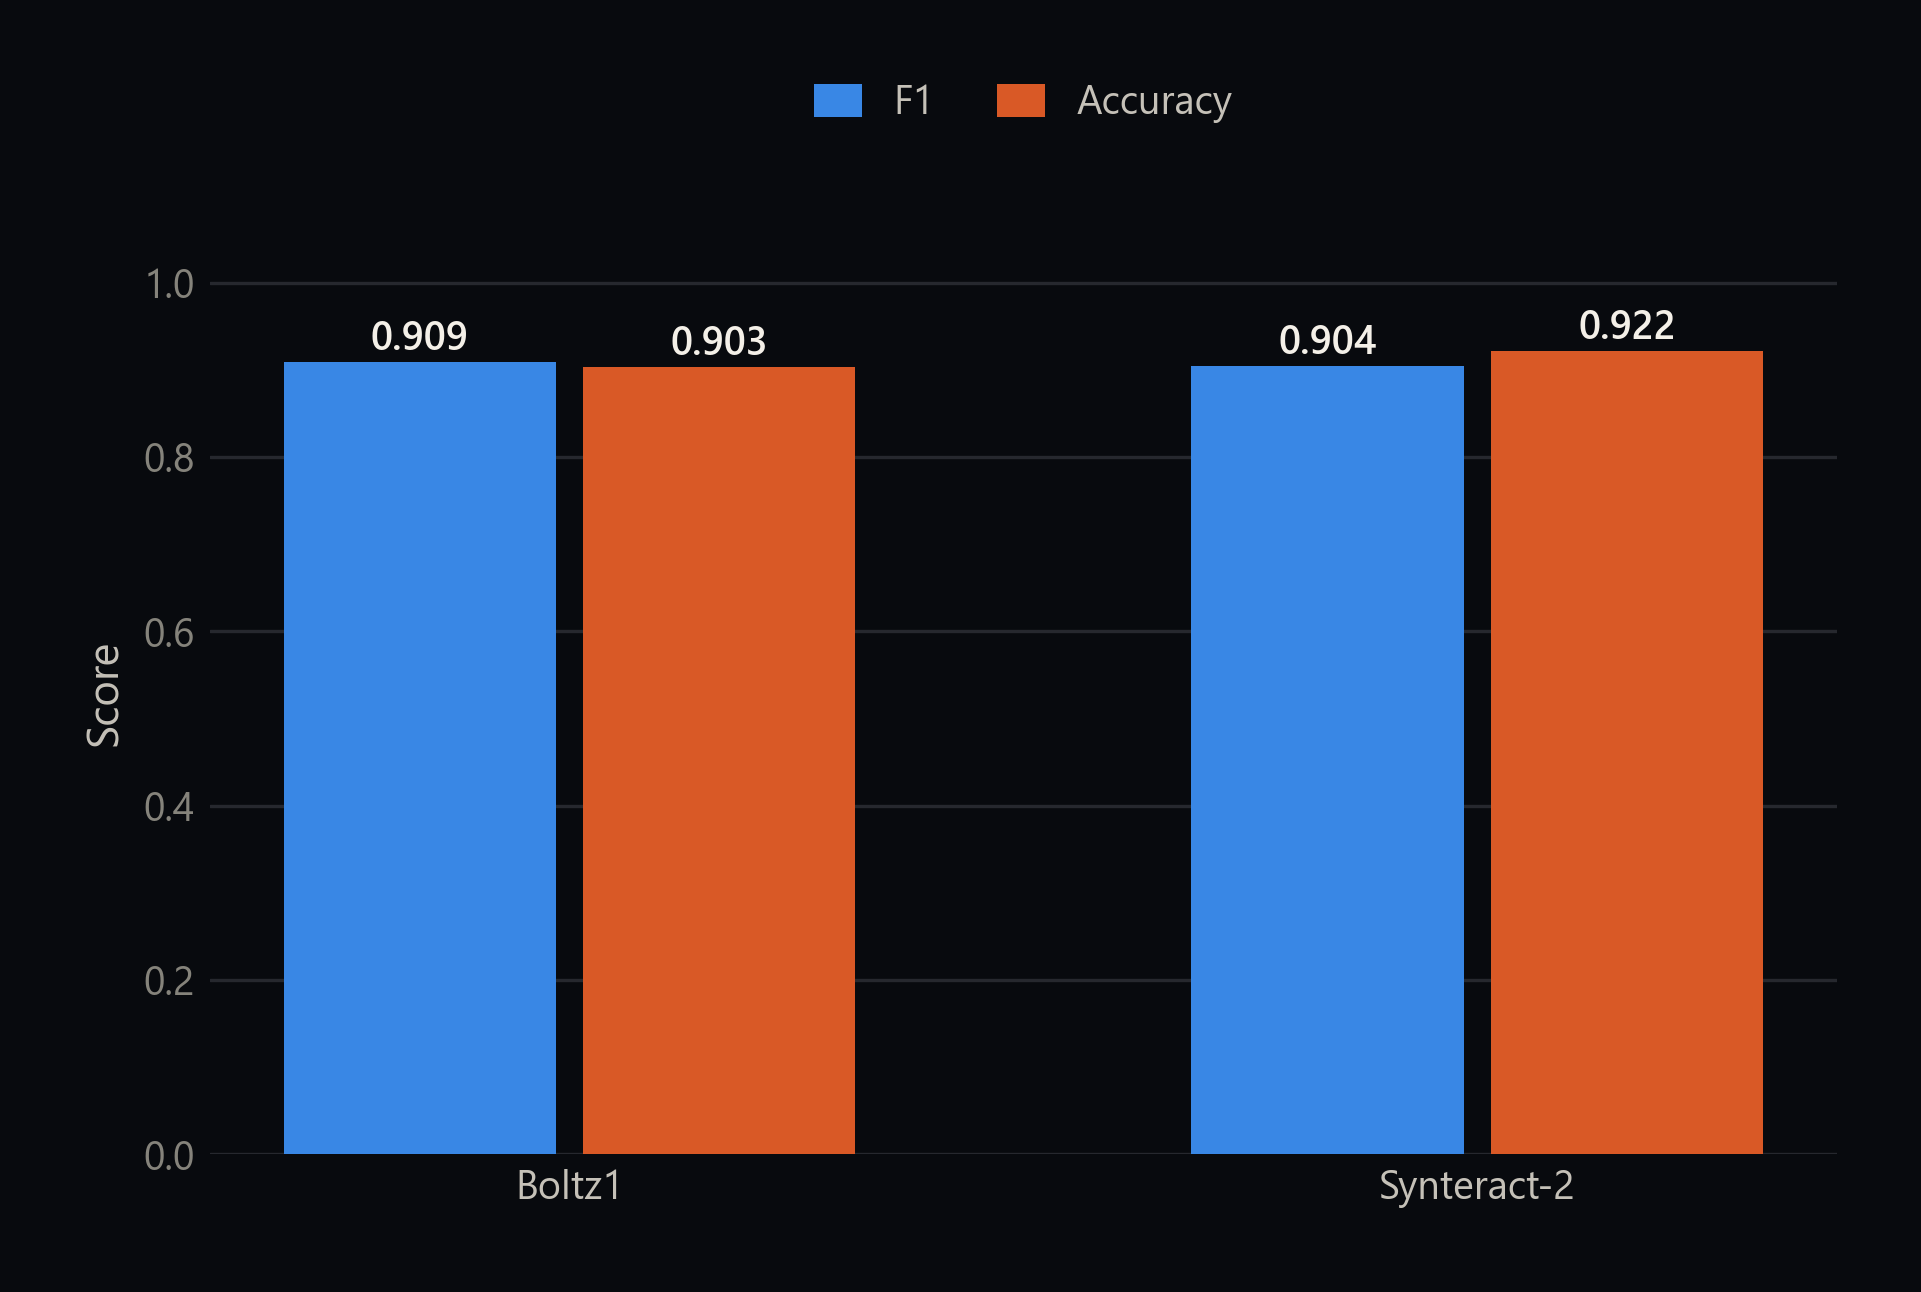
Synteract-2 reaches an F1 of 0.904 and accuracy of 0.922, against Boltz1's 0.909 and 0.903. Statistically these are close to indistinguishable, and the error bars in the source figure overlap substantially.
What this does not show
Boltz1 may have been trained on the PDB structures used in this test set. If so, part of what it is doing is recall rather than prediction, which would make the comparison flatter than it looks.
Setting the comparison aside, the standalone claim is the interesting one: a sequence-only model can identify interface residues at a level in the same range as a structure model. That has a practical consequence, since a sequence model can be run on anything with a sequence, including designed proteins with no structure and proteins whose structure prediction is unreliable.
Terms used here
Where it sits in the stack
Atlas needs interaction predictions that scale, and it also needs outputs a researcher can act on. Those are different requirements, and they are served by different models.
Synteract-4 handles scale. It processes each protein once rather than once per pair, which makes a proteome-wide screen practical, and it deliberately returns one number per pair because that is what a search needs.
Synteract-2 handles depth. Once a screen has narrowed the field, affinity and interface predictions turn a ranked list into something with structure: which candidates look strongest, and which regions to mutate or model. For binder design that means ranking more carefully than a binary score allows. For biology it means nominating interface regions for mutagenesis.
Limitations
Synteract-2 predictions are neither binding measurements nor solved structures.
Measured affinity depends on assay conditions, concentration, conformational state, cofactors, post-translational modification, and cellular context, none of which a sequence model observes. Binding-site metrics depend on how the benchmark was constructed and, in the Boltz1 comparison, on possible training overlap.
The DSM binder campaign is a concrete illustration of the gap. Predicted affinities from a Synteract-2-family model were used to rank 1.4 million generated designs, and when forty of them were measured, the target the predictions rated hardest produced the campaign's only clear success. The ranking was useful for narrowing the pool. It was not correct in its details.
Treat the model as a prioritization layer. It helps decide where to look next. Deciding what is true is still the experiment's job.