 Synthyra
Case Study
7 min read
From Generated Sequence to Measured Binding
A diffusion protein language model generated binder candidates for EGFR and PD-L1, and 40 of them were expressed and assayed. This is what the measurements showed, including the failures, and how they relate to what the model actually predicted.
Logan Hallee
July 31, 2025
Protein sequences are almost free to generate. A model can emit a hundred thousand candidates for a target overnight, and every one of them will look plausible in the only sense software can check, which is that some other piece of software scores it well.
Experimental capacity is not free. The interesting transition is therefore never from one computational score to another. It is from a proposed sequence to a physical molecule that either expresses in a cell or does not, and either sticks to its target or does not.
Forty DSM designs made that crossing. This is what happened to them.
Two sources, kept separate
Representation and generation results in the DSM manuscript are all computational. The binding affinity numbers are predictions from a separate model, and the authors state that they "relied on in-silico proxies for secondary structure, function, and binding affinity." The measured binding data described below sits in the project repository and does not appear in the manuscript. Where this article says "measured," it means the repository data. Where it says "predicted," it means the paper.
What the model is
Most protein language models are trained by masking about 15 percent of a sequence and asking the model to fill in the gaps. That produces excellent representations and a weak generator, because a model that has only ever seen lightly corrupted inputs has no idea what to do with a mostly blank one.
DSM changes the corruption schedule. Instead of a fixed 15 percent, the mask rate is drawn uniformly from zero to one on every batch, and the loss is reweighted by that rate so low-mask examples are penalized harder. The model therefore trains across the entire corruption range, from nearly-complete sequences down to nearly-empty ones. Generation is then the same operation run in reverse: start from all mask tokens and fill in.
Training details
DSM extends pretrained ESM2 checkpoints with the LLaDA masked-diffusion objective, plus a modified language modeling head with a soft logit cap and tied output projection. The 650 million parameter model was trained on OMG-Prot50, over 207 million sequences clustered at 50 percent identity, at a global batch size of 128 and a maximum length of 2,048. That run took 12 days on four A100 GPUs. A LoRA-adapted variant, DSM-ppi, conditions generation on a target sequence by giving the model the target intact and the binder masked.
The payoff of the variable mask rate shows up at high corruption. Even at 90 percent masking, DSM reconstructs sequences with an alignment score around 0.27, which is more than four standard deviations above what randomly paired natural proteins score. It also holds a 2.4 to 37.8 percent F1 advantage over DPLM depending on mask rate. Below 15 percent masking, ordinary ESM2 models are better, a fair trade since that is the regime they were built for.
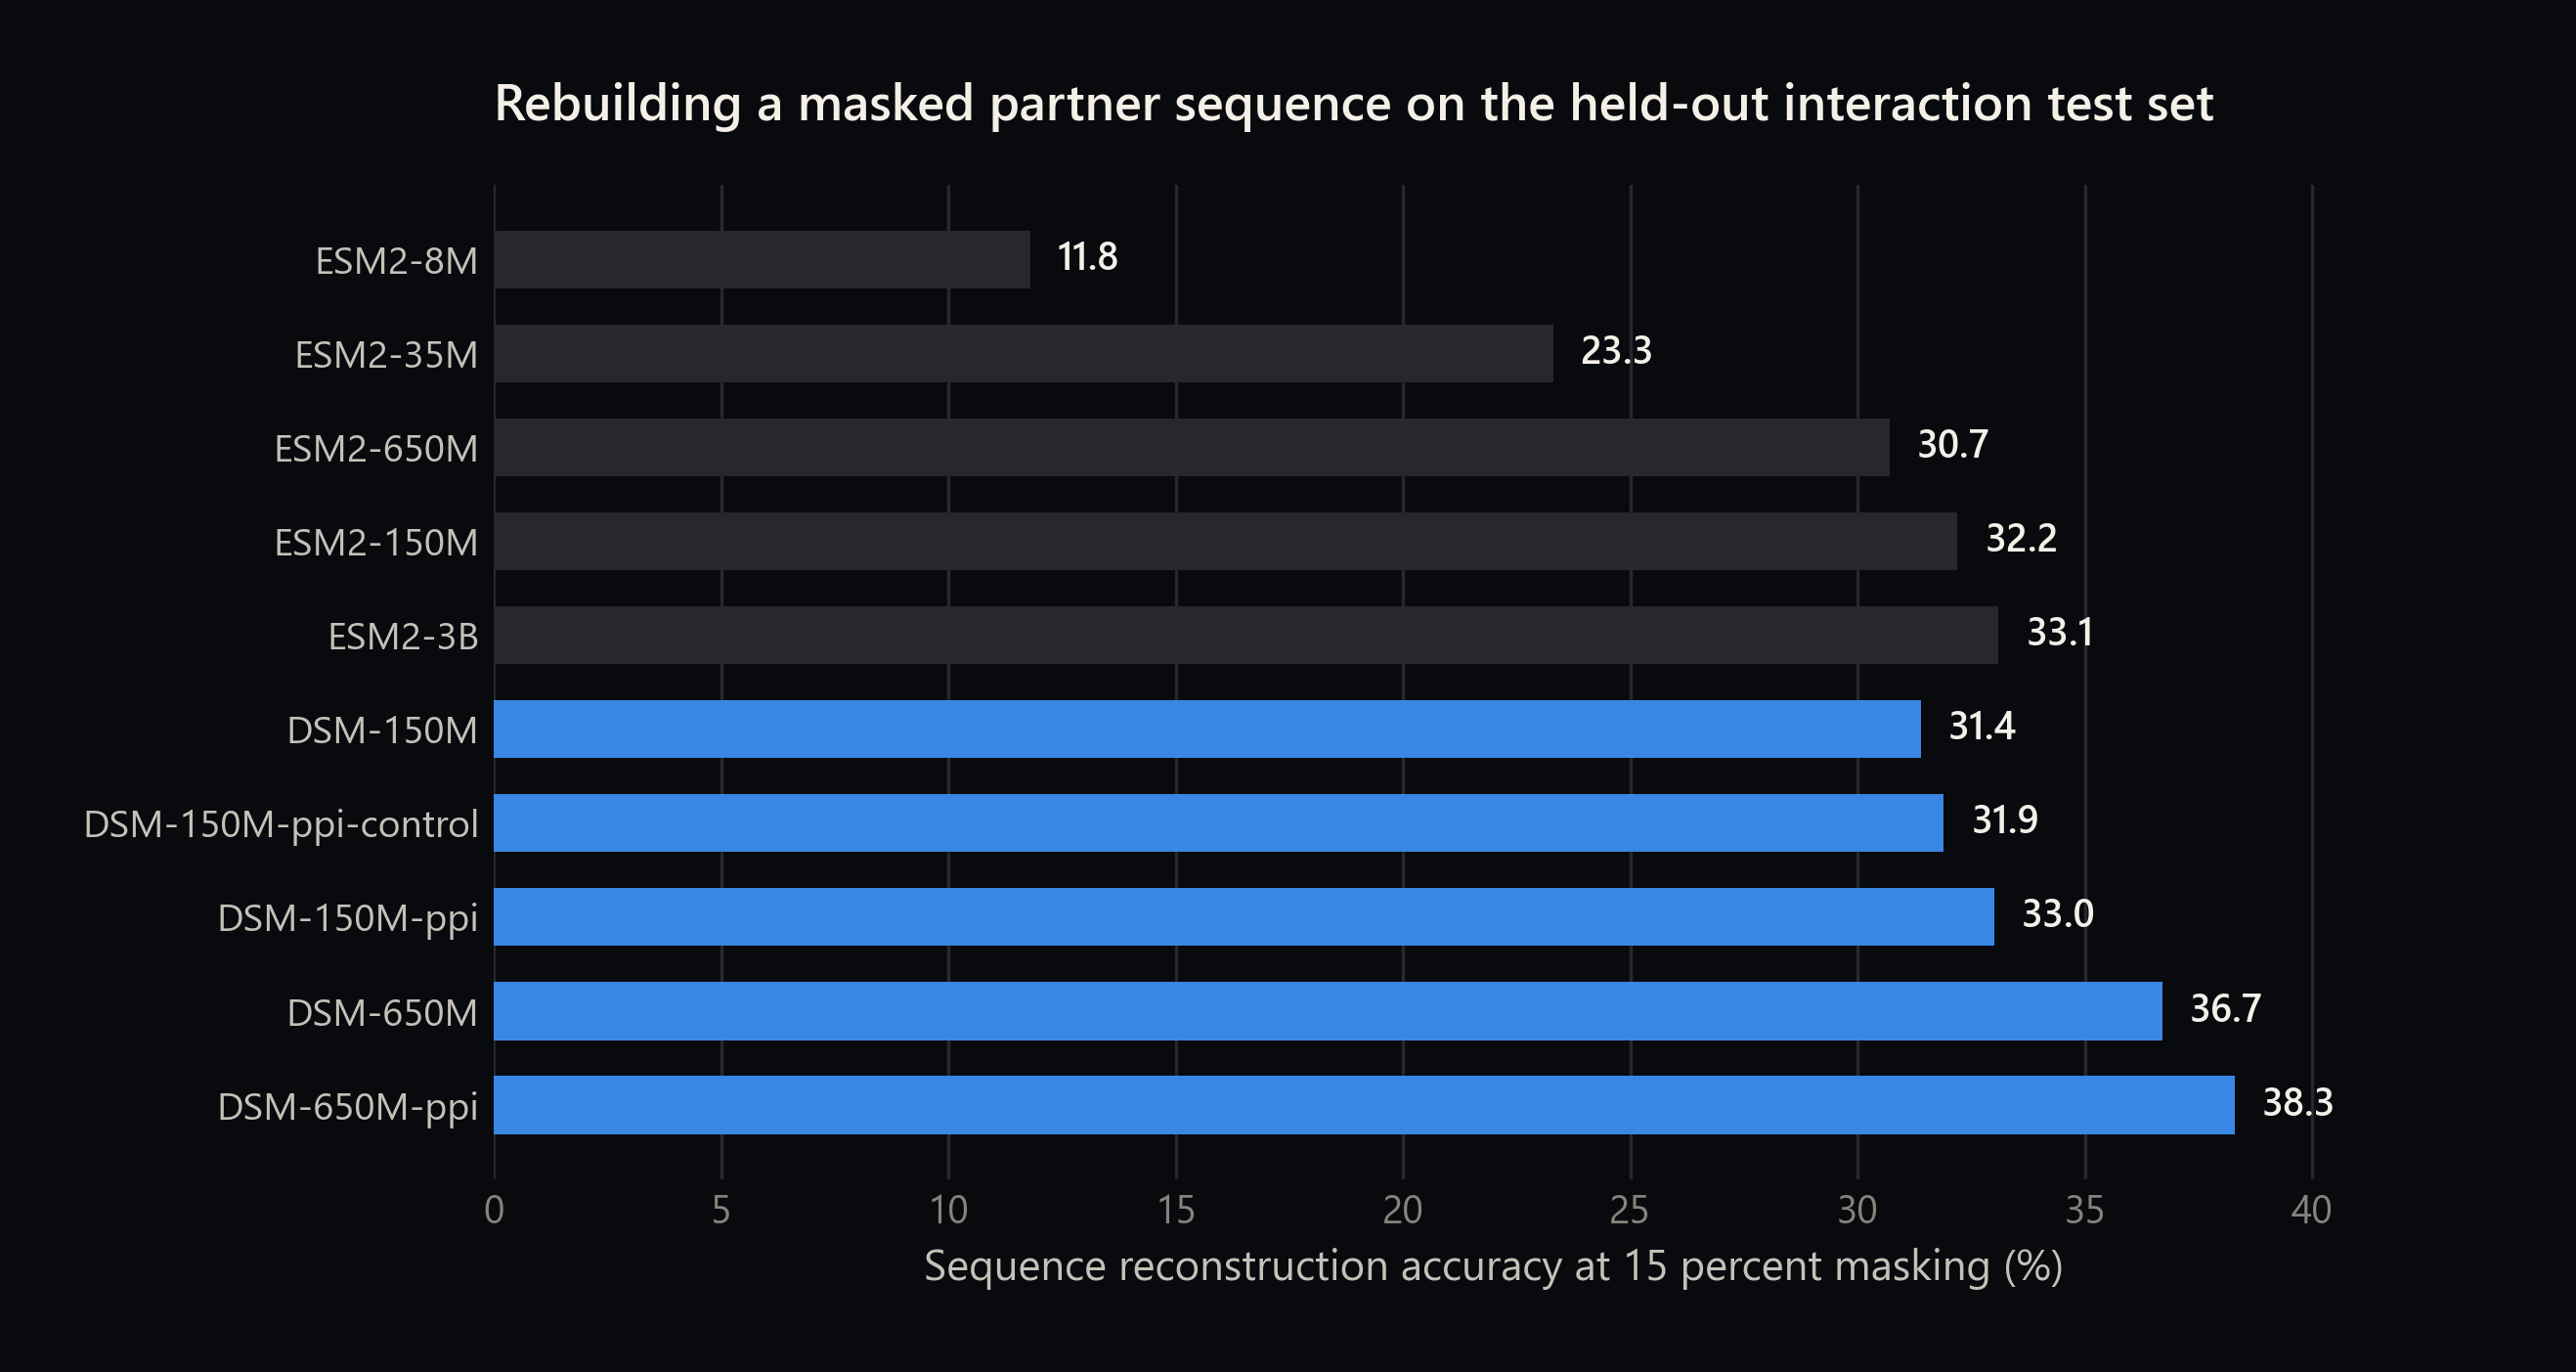
The conditioning works, though modestly. Giving the model the target sequence lifts reconstruction accuracy from 31.4 to 33.0 percent at the 150 million parameter scale, and the control that receives the same extra training without the target lands in between at 31.9 percent. So roughly half the gain is target information and half is simply more training.
The designs, and where they came from
For binder generation the evaluation uses BenchBB, a set of seven targets each paired with a literature-derived best-known binder: EGFR, IL-7Rα, MBP, PD-L1, BBF-14, BHRF1, and Cas9. For each target, 100,000 candidates were generated by masking a template binder at a uniformly random rate and letting DSM fill it back in, for 1.4 million sequences in total.
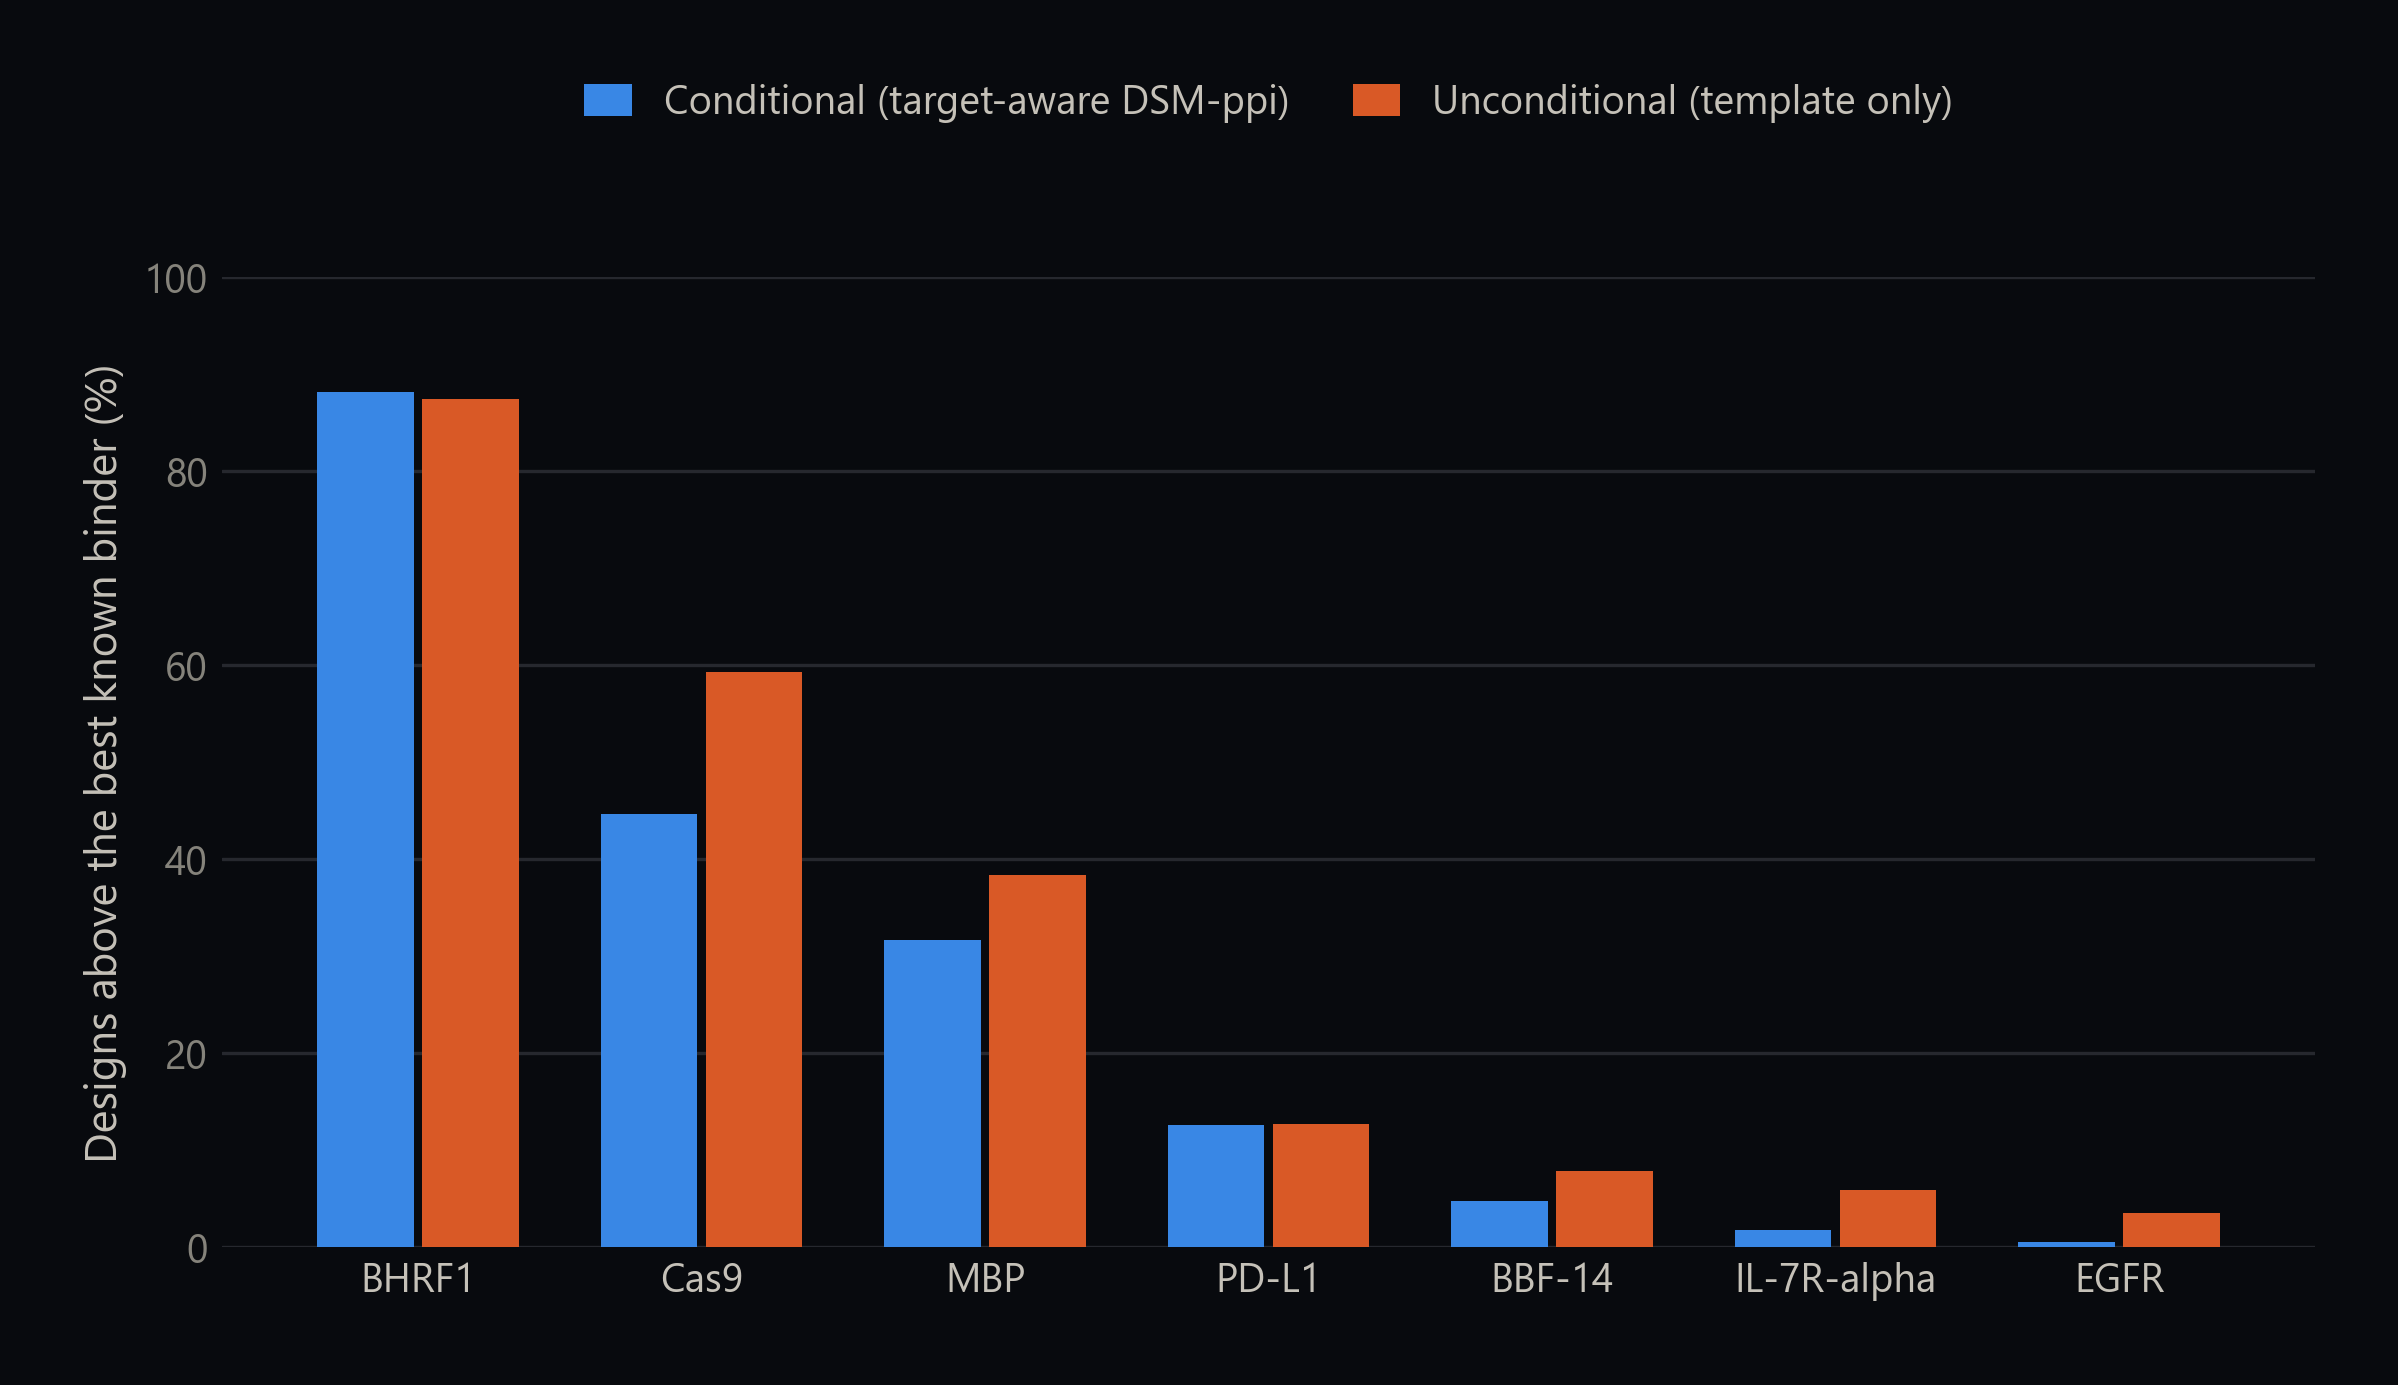
That observation deserves more scrutiny. The target-conditioned DSM-ppi model was the point of the fine-tuning, and by this metric the unconditional model beats it almost everywhere. There are benign explanations. The template already encodes a great deal about the target, and the predicted-affinity scorer may simply prefer sequences closer to the template distribution. But the comparison goes undiscussed, and on the reported numbers the case for conditioning is weaker than the framing suggests.
The y-axis matters here. "Success rate" here means a second model predicted a higher affinity. That is a screening signal, not a result.
Into the lab
Twenty EGFR designs and twenty PD-L1 designs were expressed and assayed, two replicates each, across a five-point concentration series. The first thing that happens to a designed protein is not binding. It is expression, and expression is where designs die.
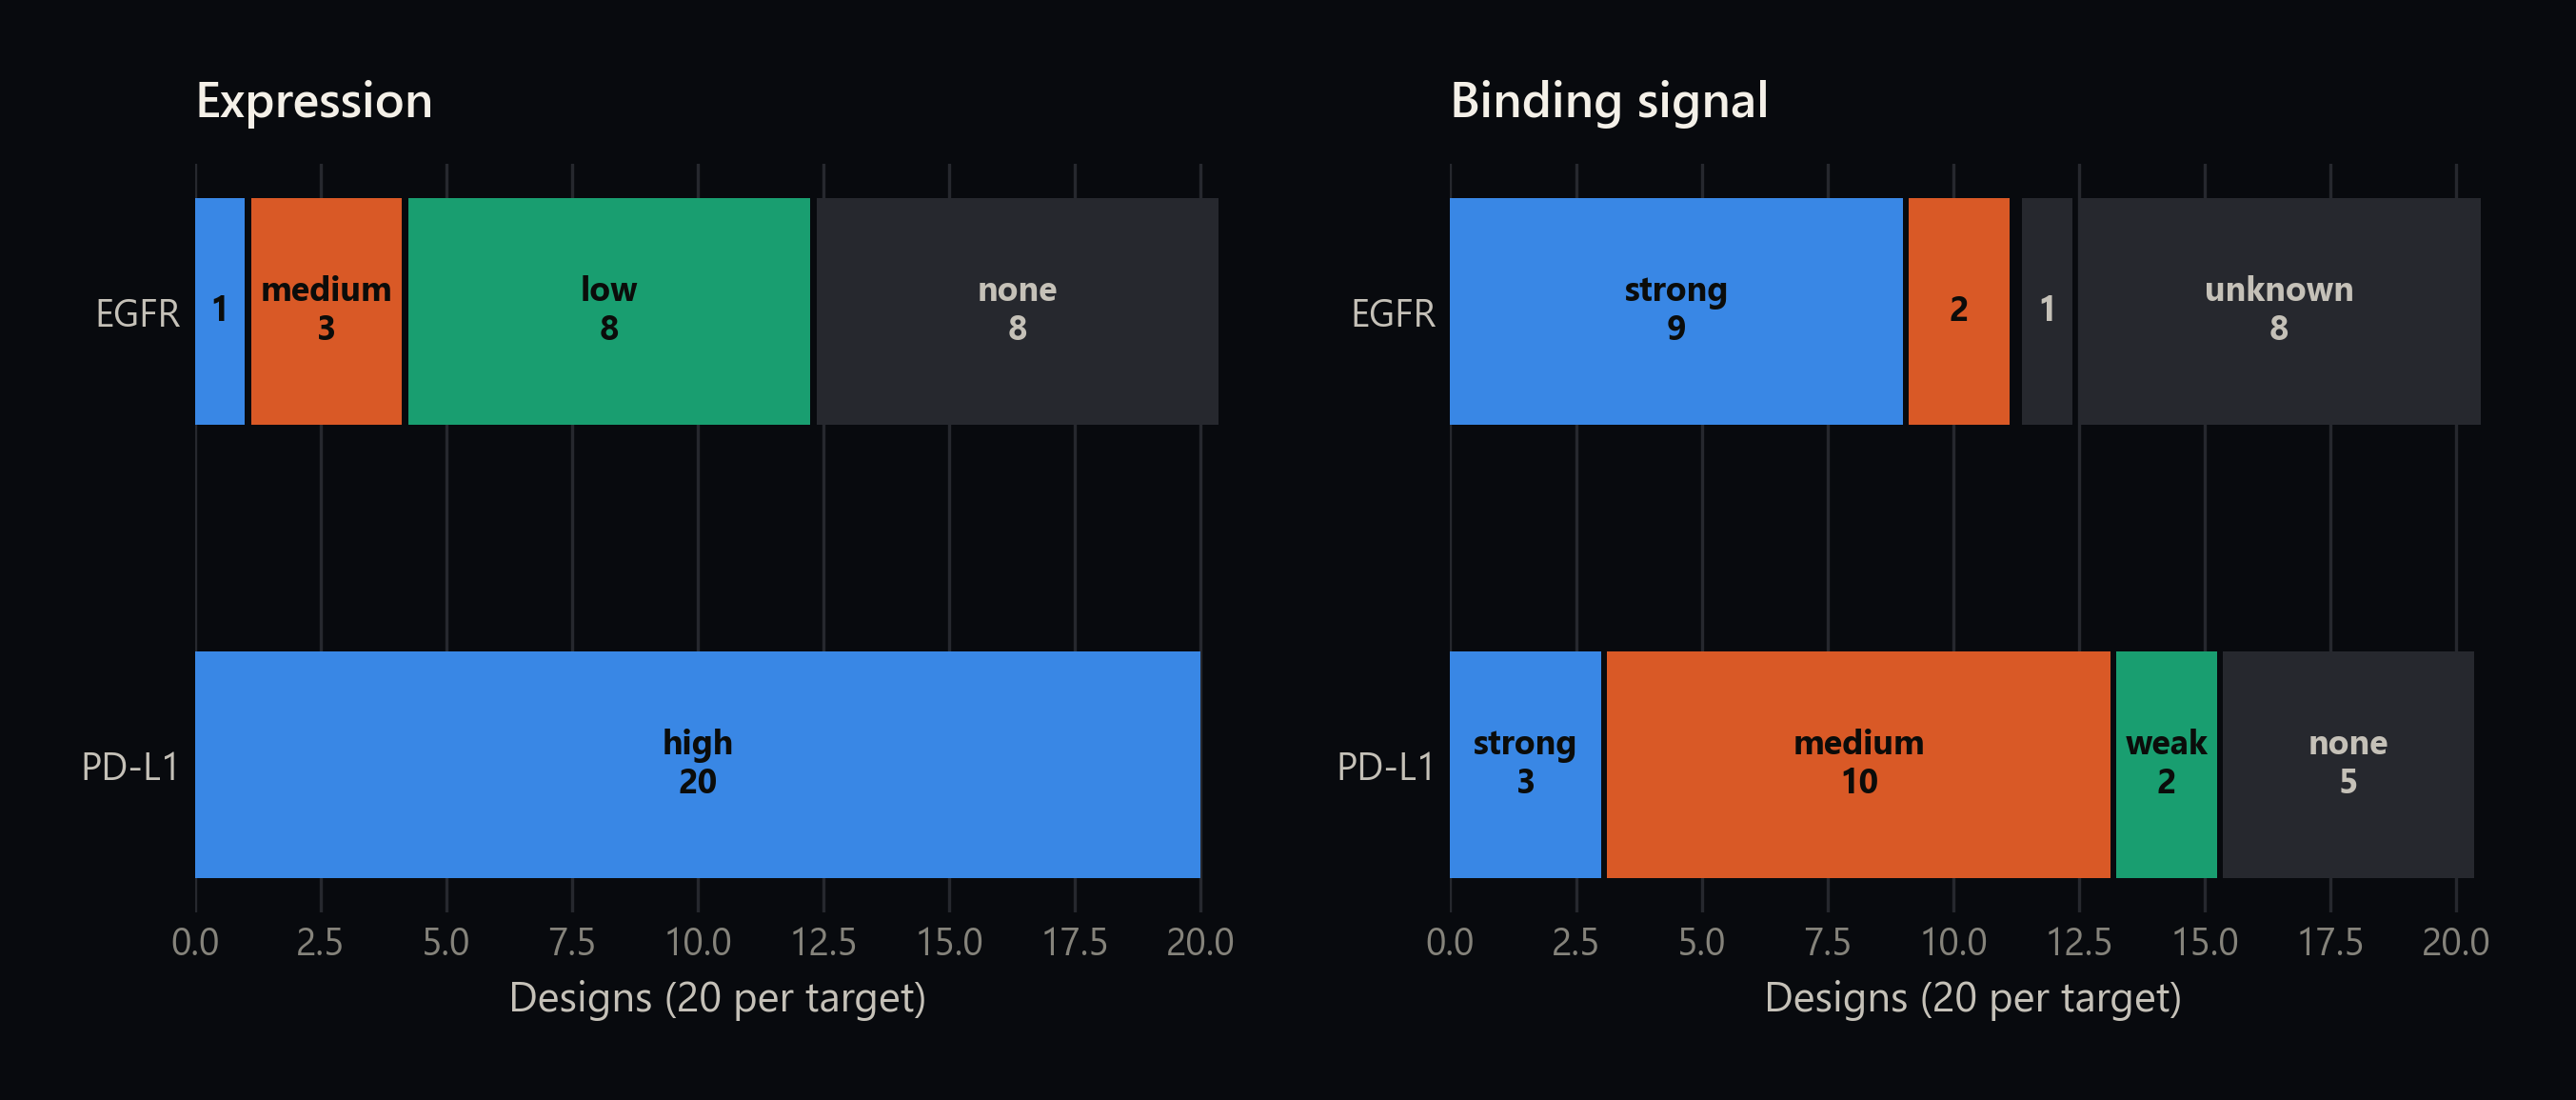
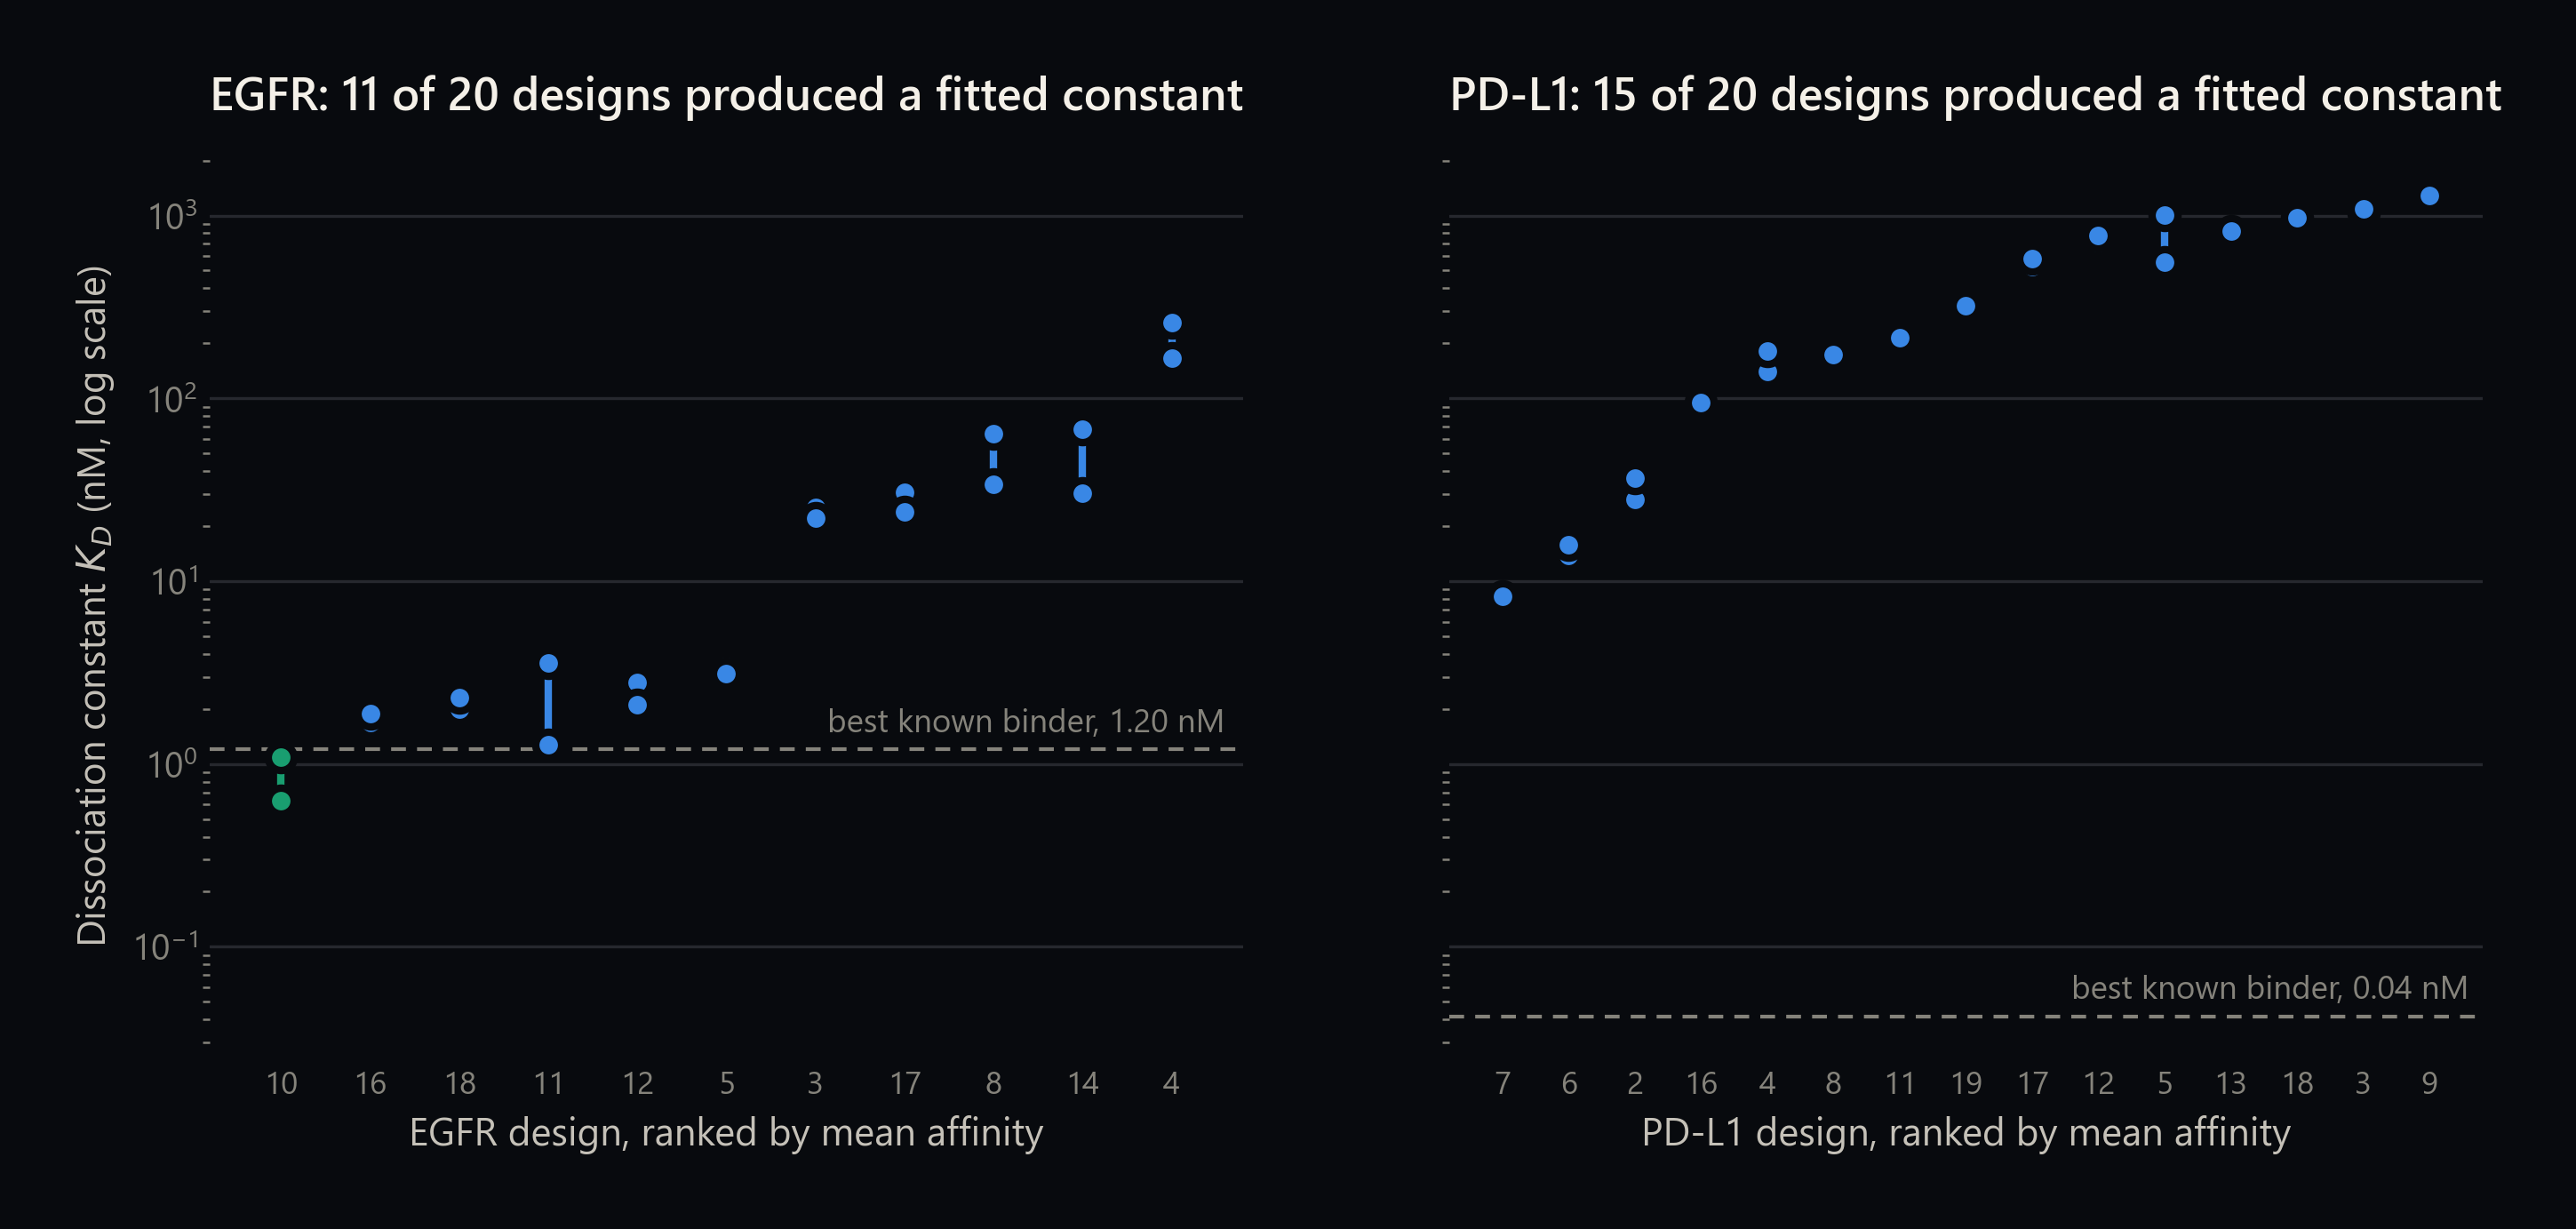
The two campaigns failed and succeeded in opposite ways. Every PD-L1 design expressed at high level; 8 of 20 EGFR designs produced nothing at all. Of the designs that did express, 11 EGFR and 15 PD-L1 candidates yielded a fitted dissociation constant.
Measured outcomes
0.861nM
Best EGFR design
dsm_egfr_10, mean of 0.628 and 1.095 nM; reference binder is 1.20 nM
11of 20
EGFR designs with a fitted constant
8 never expressed, 1 expressed without binding
8.06nM
Best PD-L1 design
dsm_pdl1_7; reference binder is 0.04 nM, roughly 190-fold tighter
The EGFR campaign produced a genuine result. One design, dsm_egfr_10, bound recombinant EGFR at a mean fitted dissociation constant of 0.861 nM across two replicates, which is tighter than the 1.20 nM reference binder taken from the literature. Five more designs landed within a few-fold of it. A generated sequence survived expression and outperformed the incumbent on the target it was designed against.
The PD-L1 campaign did not. Everything expressed, most designs bound something, and the best of them was still roughly 190-fold weaker than the reference binder. Reading only the EGFR half of this campaign would give a badly distorted picture of what the system currently does.
What this does not show
These are two targets, forty designs, and two replicates apiece. No structure was solved, so the geometry of any of these interactions is unknown. Binding to a purified recombinant target under assay conditions is not the same as engaging that target in a cell, in tissue, or in an organism. And a single strong hit out of forty attempts, on one of two targets, is a starting point rather than a demonstrated capability.
Predicted against measured
The most useful thing about having both halves is that they can be compared, and the comparison is not flattering to the predictions.
By the model's own predicted-affinity screen, EGFR was the hardest of the seven targets: only 0.59 percent of conditional designs and 3.55 percent of unconditional ones scored above the reference binder, the lowest rates in the whole benchmark. PD-L1 looked considerably more promising at 12.64 and 12.75 percent.
The measurements inverted that. EGFR produced the campaign's one clear win. PD-L1, the more promising target on paper, produced nothing near its reference.
Predicted affinity is a filter that makes a 100,000-candidate pool small enough to test. It is not a ranking you should trust to be correct in its details. The DSM authors note in their limitations that integrating wet-lab feedback is "a natural next step." These forty measurements are the first increment of exactly that feedback, and their main value is as training signal about where the predictions go wrong.
Terms used here
What this establishes
Narrowly: a masked-diffusion protein language model produced a candidate that expressed, bound its target, and measured tighter than the best binder reported for that target in the literature. That crossing from software to a physical molecule with a number attached to it is the part that counts, and most generated sequences never make it.
Just as narrowly: the same system produced eight EGFR designs that could not be manufactured, and an entire PD-L1 series that fell far short. The predicted-affinity screen that was supposed to tell the two campaigns apart got their relative difficulty backwards.
Both of those are the result. A design system is characterized by its hit rate and its failure modes together, and forty measurements is enough to see the shape of both while being nowhere near enough to fix either.
Source
Diffusion Sequence Models for Enhanced Protein Representation and Generation
Logan Hallee, Nikolaos Rafailidis, David B. Bichara, Jason P. Gleghorn
arXiv preprint, June 2025. The binding measurements described here are not part of the preprint.