 Synthyra
Research
7 min read
Protify: Model Choice As An Experiment
Protify standardizes protein language model benchmarking across zero-shot, probing, and transfer-learning settings. Running it at scale shows there is no universally best model, and that a lightweight probe on the right backbone can beat a purpose-built specialist.
Logan Hallee
August 21, 2025
Protein language models are not interchangeable. ESM2, ESMC, E1, ProtT5, ANKH, DPLM, DSM, GLM2, AMPLIFY, CaLM, and the rest all produce useful representations, and they do not succeed or fail in the same places.
That makes model choice an empirical question. A model that excels at variant effect prediction may be mediocre for enzyme classification, localization, solubility, interaction prediction, or sparse gene ontology labels. Yet the field mostly answers this question by reading abstracts, because running the comparison yourself means reimplementing everyone's preprocessing.
Protify exists to make the comparison cheap enough that you run it instead of guessing.
What the platform actually does
Four stages. You specify models and datasets through a graphical interface, a command line, or a YAML file. Sequences are tokenized and passed through the selected models to produce per-residue embeddings, cached locally or pulled from a hub. Those embeddings train a downstream predictor using one of six adaptation strategies: linear probe, transformer probe, hybrid probe, LoRA, LoRA plus hybrid, or full finetuning. Metrics, plots, and a replayable log file come out the other end, and feeding that log back into the entrypoint reproduces the whole experiment.
One design decision affects every number downstream. Protify pools per-residue embeddings into a single vector by concatenating the element-wise mean and variance across positions. That default was not assumed; it was selected by ranking 46 pooling configurations across ten datasets. Mean-and-variance came first with a summed rank of 60, ahead of mean-and-standard-deviation at 91 and median-and-variance at 101. Plain mean pooling, the field's usual default, ranked seventh.
Case one: zero-shot variant effects
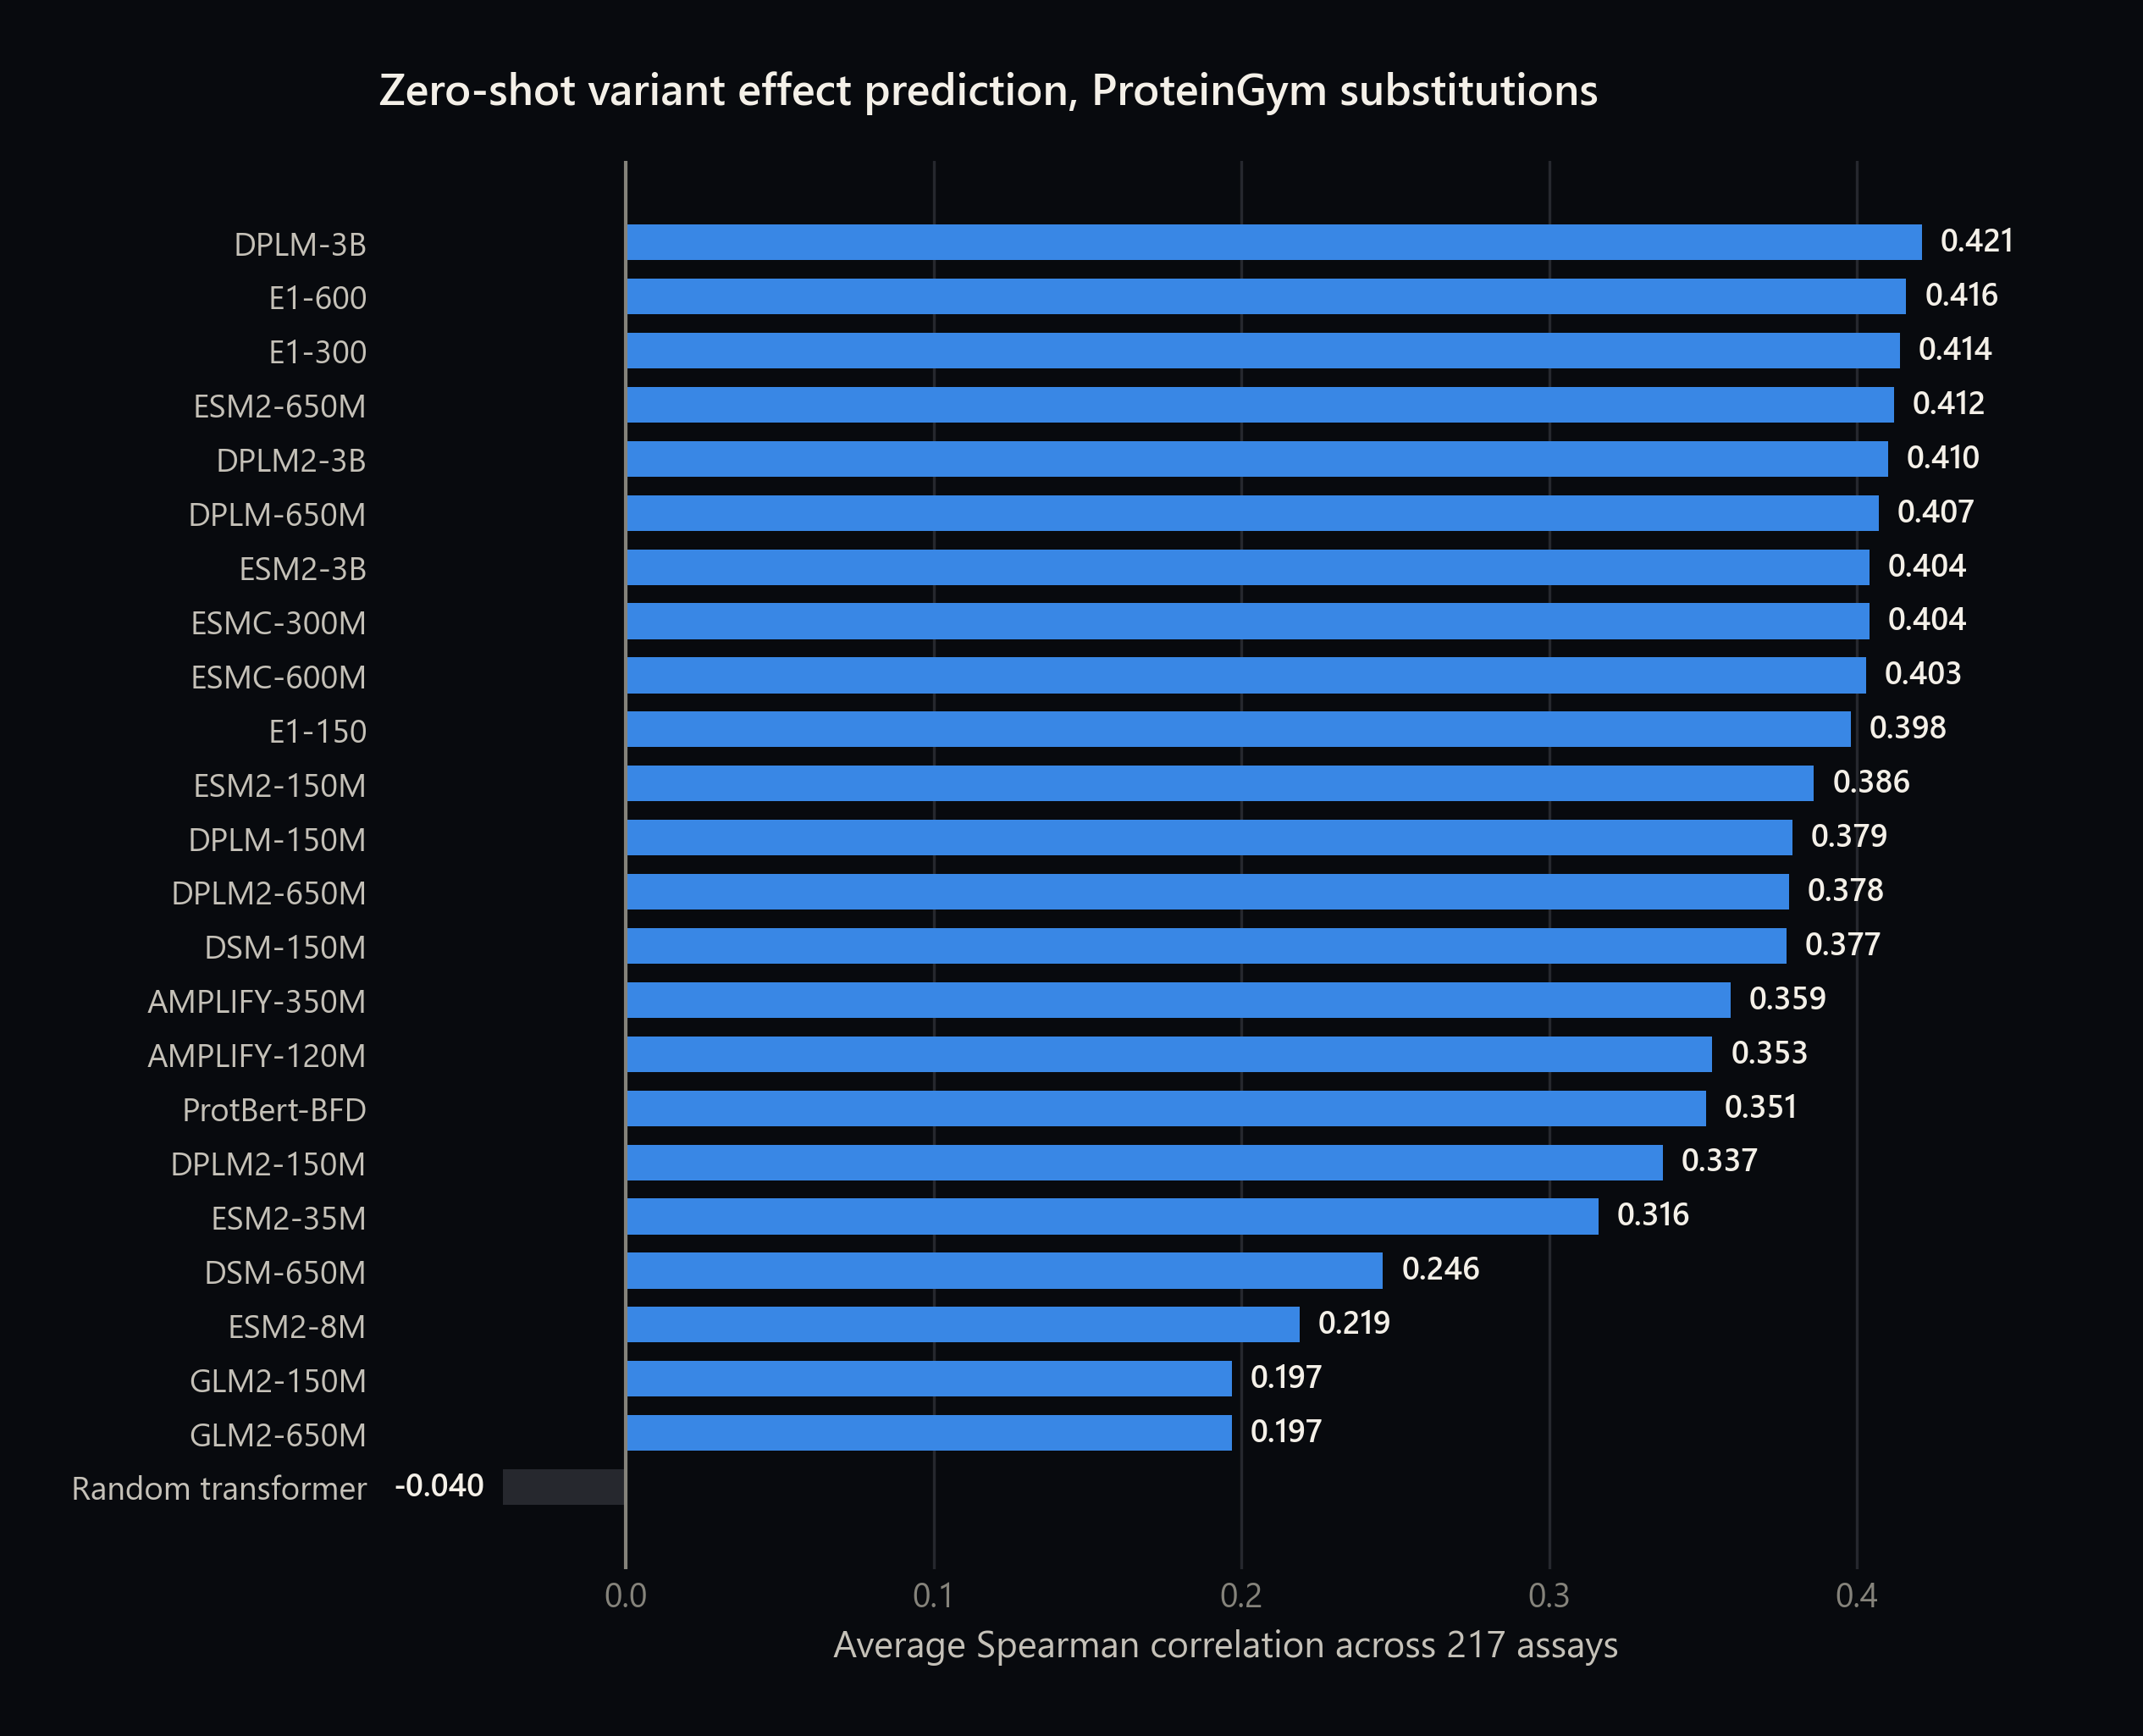
The first study runs 23 models against the ProteinGym substitution benchmark, 217 deep mutational scanning assays, scored by masked marginals with no supervised training at all.
DPLM-3B leads at 0.421, the best reported for a model using only semi-supervised denoising and single-sequence input. But the more instructive reading is the shape of the list rather than its top.
Parameter count is a weak predictor. ESM2-650M (0.412) beats ESM2-3B (0.404). AMPLIFY-350M (0.359) scores below the half-sized ESM2-150M (0.386) and roughly level with ProtBert-BFD (0.351), a considerably older model. DSM-650M (0.246) lands well below DSM-150M (0.377), an inversion within one model family.
That last one matters for how these numbers should be read at all, because DSM-650M ranks fourth overall on the supervised benchmark below. Same model, two evaluation protocols, opposite conclusions.
Case two: 32 supervised tasks, and no winner
The second study fixes the protocol (frozen embeddings, mean-variance pooling, the same probe, three seeds) and runs every model against 32 datasets spanning enzyme classification, gene ontology, localization, interaction, solubility, stability, and several regression targets.
Across 32 supervised tasks
13
Different models won at least one task
Most frequent winner took 6
0of 32
Statistically significant wins
Welch's t-test, Benjamini-Hochberg corrected
0.54
Where the top models converge
Average MCC, a suspiciously flat ceiling
No single model dominates. DPLM-3B takes the most datasets, ANKH-Base is next, and eleven other models win somewhere. More pointedly, on none of the 32 datasets is the gap between best and second-best statistically significant.
Read that carefully in both directions
With three seeds per model the Welch tests are badly underpowered, so non-significance is close to expected and does not establish that the models are equivalent. What the table does show is that winner margins are small relative to run-to-run variability. A leaderboard position built on a margin like that is not a finding.
Two results cut against intuition. CaLM, the only codon-level model in the panel, achieved the top score on soluprot, a protein-sequence dataset it can only reach through deterministic reverse translation. On ecoli_expression, the one native DNA dataset where its codon context should have been an advantage, it came last at 0.23 MCC while AMPLIFY-120M reached 0.47.
And ProtBERT-BFD, one of the oldest models tested, tops both taxonomy tasks. Which is exactly what the accidental taxonomist work would predict: taxonomic signal is abundant in these representations, and being good at detecting it is a distinct skill from being good at biology.
Case three: beating a specialist with a probe
The third study is the one with a practical lesson attached. EpHod is a purpose-built model for predicting an enzyme's optimal pH, selected from 11,550 training runs across architectures and representations, and pretrained on 1.9 million environmental pH annotations.
Protify's all-versus-all sweep identified DPLM2-3B as the strongest backbone for this task. A linear probe on its frozen embeddings, trained in seconds, reached an R² of 0.393, already close to EpHod's 0.425. Swapping in a transformer probe with hyperparameters from a 50-run sweep pushed it to 0.482.
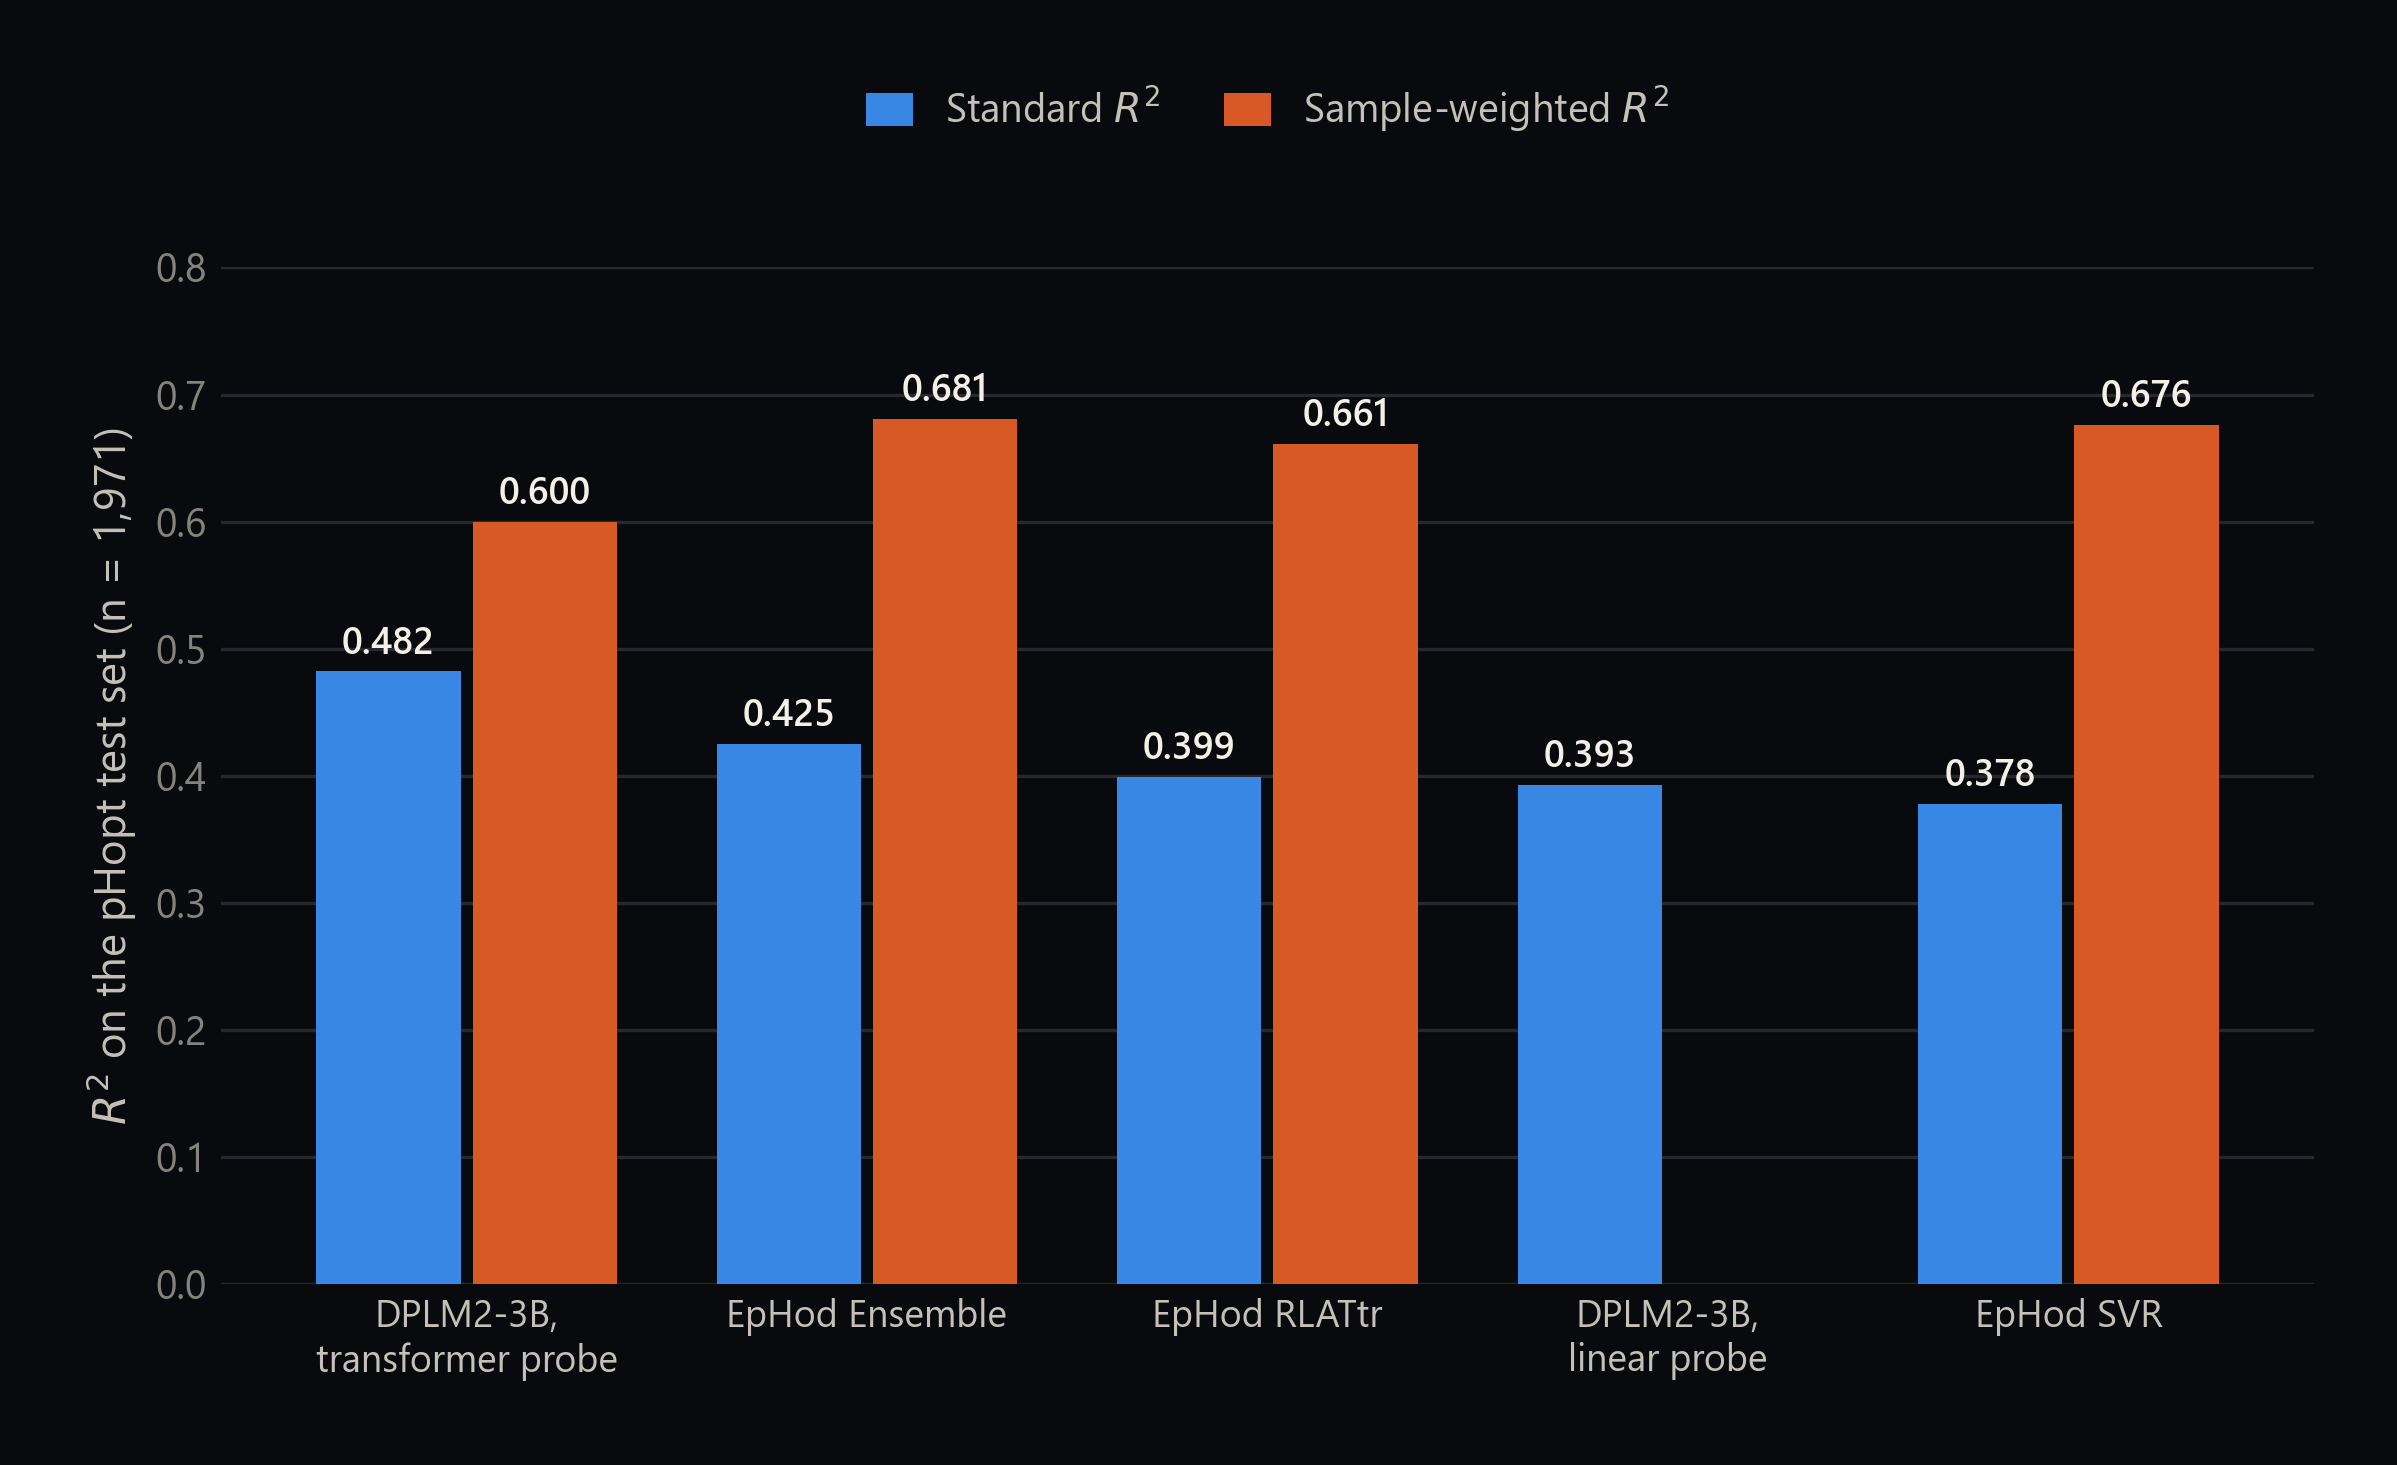
The probe surpasses EpHod's ensemble on all four standard regression metrics. On sample-weighted metrics, which upweight the rare acidic and alkaline enzymes, all three EpHod variants beat it. That is not mysterious: EpHod trains with bin-inverse loss reweighting and the probe trains with plain mean squared error. On the rarest alkaline bin the probe's F1 is 0.000, meaning it recovers no signal there at all.
There is also a data-hygiene finding buried in this study that generalizes past it. Preparing the dataset surfaced 24 identical sequences appearing across splits under different UniProt accessions, 20 of them shared between train and test. Building a homology-aware split with no cluster or sequence overlap, every linear probe collapsed. The best reached an R² of 0.039, and DPLM2-3B's linear probe scored −0.0075, worse than predicting the mean. The transformer probe held at 0.248.
What this does not show
Frozen pooled embeddings plus a linear head do not capture the sequence-to-pH relationship under strict generalization. They captured something that looked like it because homologs spanned the splits. EpHod was not evaluated on the rigorous split, so the head-to-head under those conditions remains open.
What to spend compute on
The final study asks a question every team faces: is finetuning worth it?
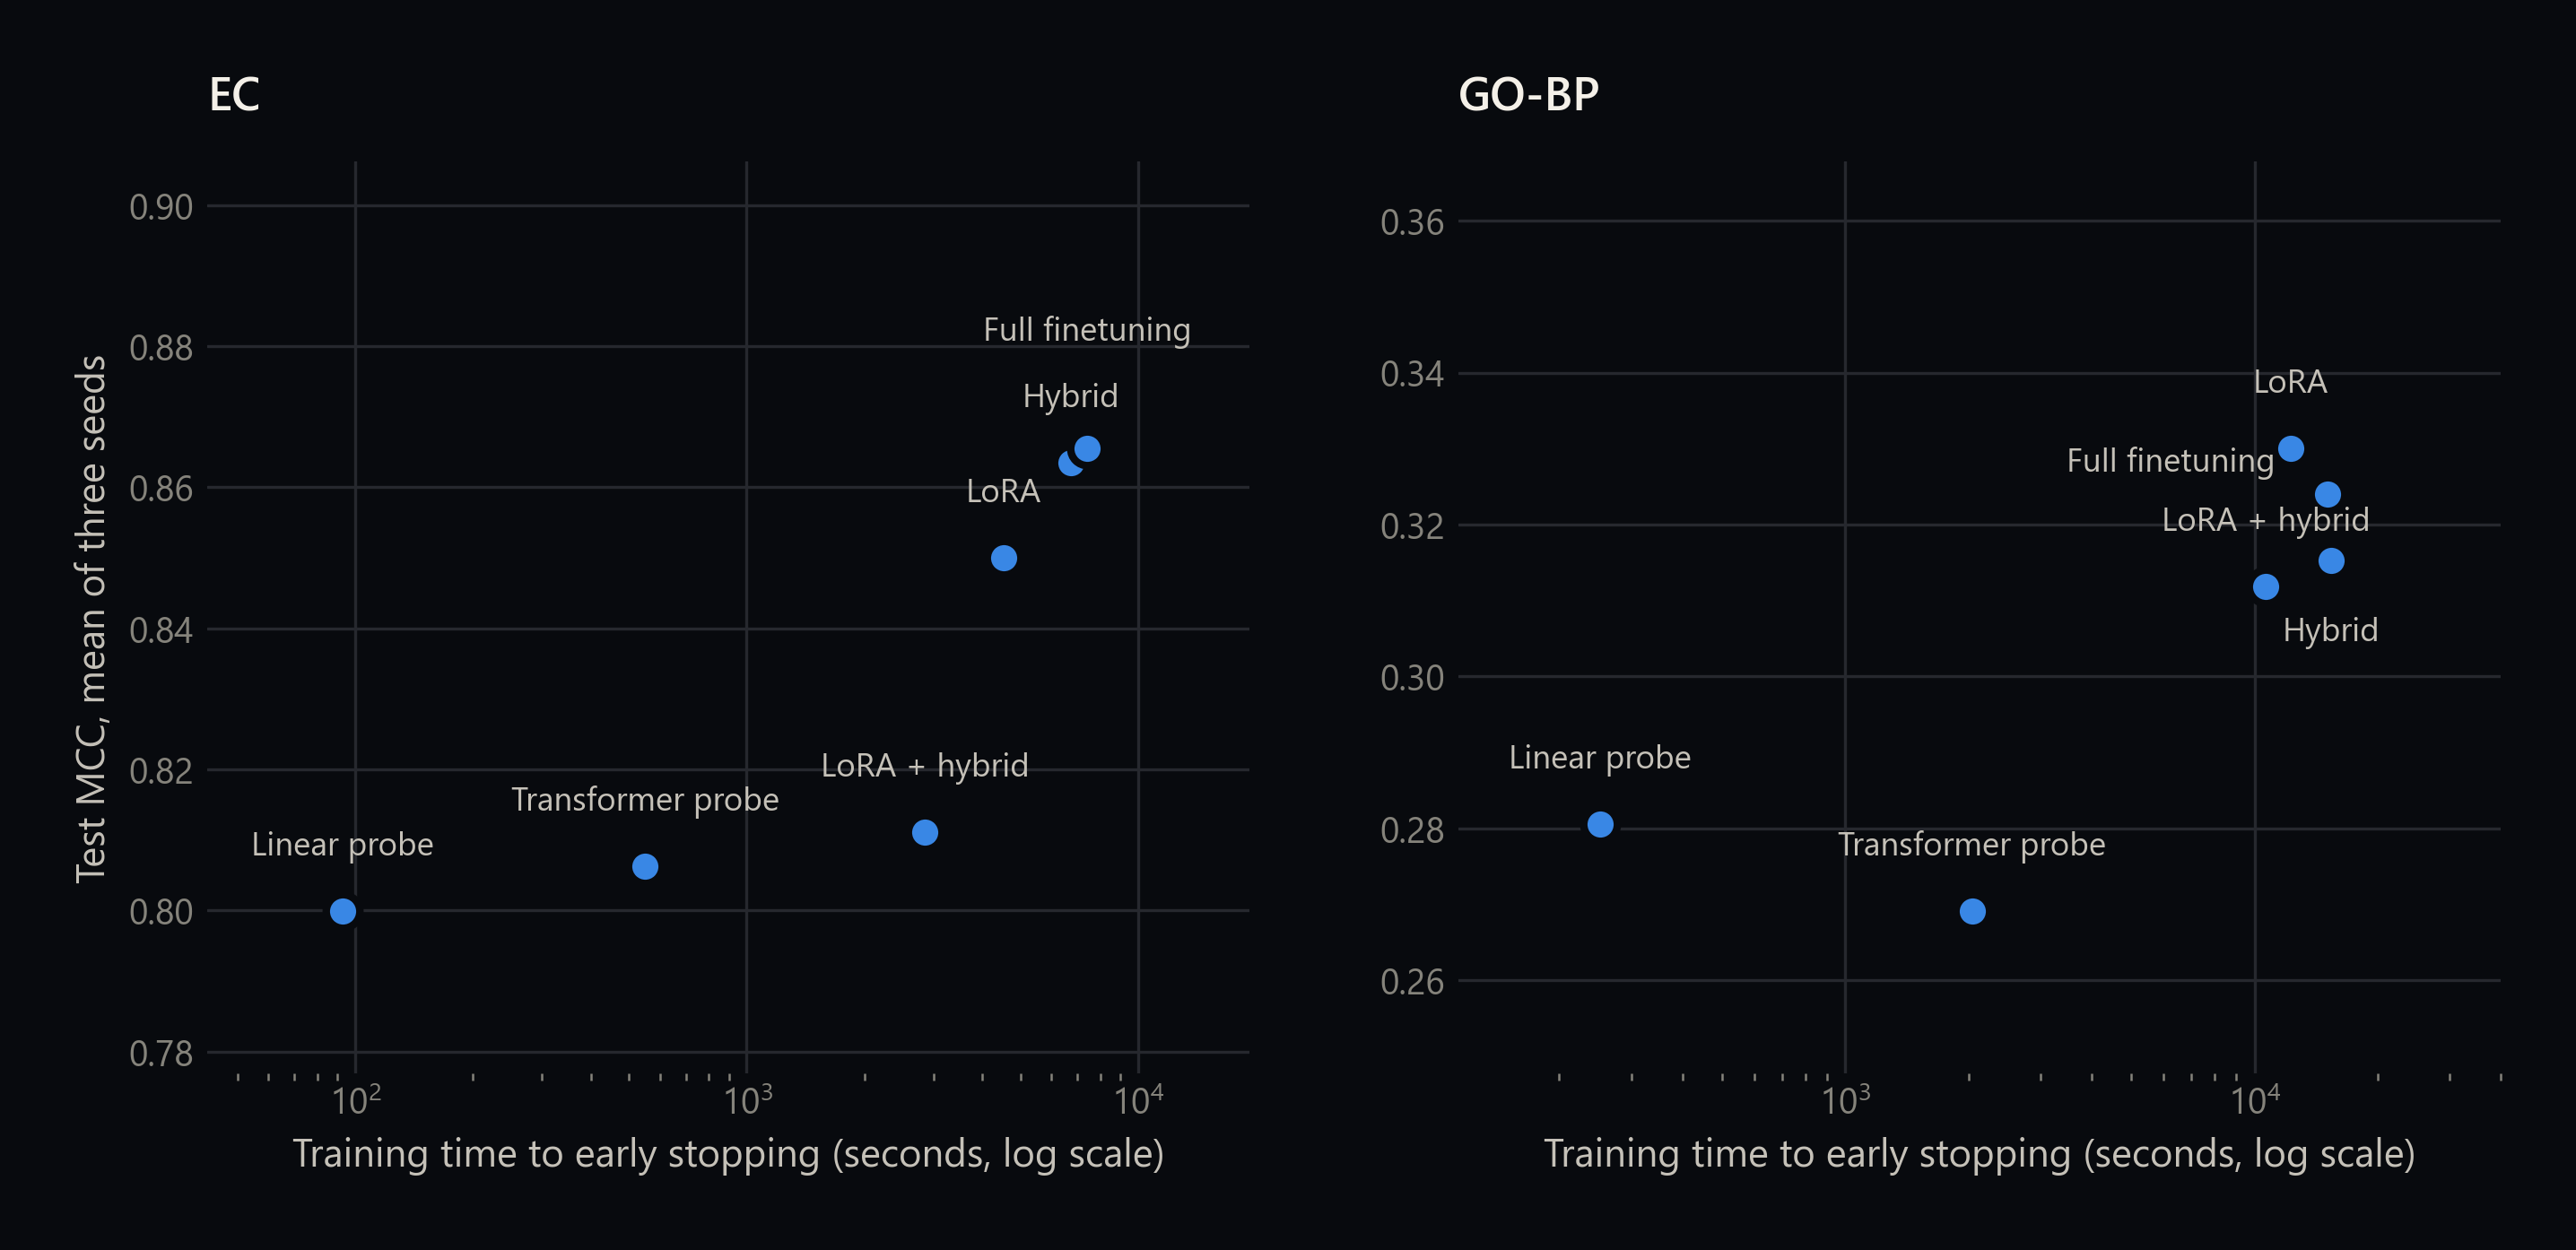
On enzyme classification the curve behaves as expected: a linear probe reaches 0.799 MCC in 93 seconds, full finetuning reaches 0.865 in 7,423 seconds. An 8 percent improvement for an 80-fold increase in training time. LoRA is the sensible middle, capturing 77 percent of the gain at 61 percent of the cost.
On gene ontology biological process, a sparse multi-label task, the ordering breaks. LoRA scores highest at 0.330, above full finetuning at 0.324. The transformer probe (0.269) does worse than the linear probe (0.281), presumably because a sparse label set gives an attention mechanism too little signal to learn from. And on both datasets, combining LoRA with the hybrid two-phase strategy underperforms either one alone.
The generalizable point is that adaptation strategy is another empirical choice, not a ladder you climb. All six strategies ran under one default recipe without per-dataset tuning, and the weight-updating strategies would likely improve with it.
Terms used here
What the aggregate picture suggests
Three patterns recur across all four studies, and they are more useful than any individual leaderboard row.
Parameter count is a first-order heuristic and not much more. Several 3-billion-parameter models lose to 650-million-parameter ones, and the losses are not confined to one family.
Rankings are protocol-dependent to an uncomfortable degree. DSM-650M is fourth of all models on the supervised benchmark and near the bottom on ProteinGym. Both numbers are correct. They measure different things, and neither is "how good is this model."
And a meaningful share of reported protein model performance may reflect how well a model's pretraining distribution overlaps the evaluation set rather than the quality of what it learned. The pHopt cross-split duplicates and the collapse under homology-aware splitting are one concrete instance of a general problem.
None of that is a reason for pessimism about the models. It is a reason to run the comparison rather than inherit it. That is the whole argument for building the platform: not that any particular model wins, but that the question is answerable under controlled conditions, and that the answer is consistently task-specific.
Source
Preparing for journal submission.